Buying ecommerce analytics software sounds simple until you begin comparing products. One platform promises hundreds of reports. Another emphasizes AI. Another focuses on dashboards.
Others specialize in customer analytics, profitability, inventory, attribution or marketplace reporting. The feature lists become long very quickly. But the question you actually need to answer is much simpler:
Will this software help us answer important store questions faster and more reliably than the tools we already have?
That should be the starting point for choosing ecommerce data analytics software. A polished dashboard is not enough. More reports are not automatically better. AI is not valuable if it produces generic answers.
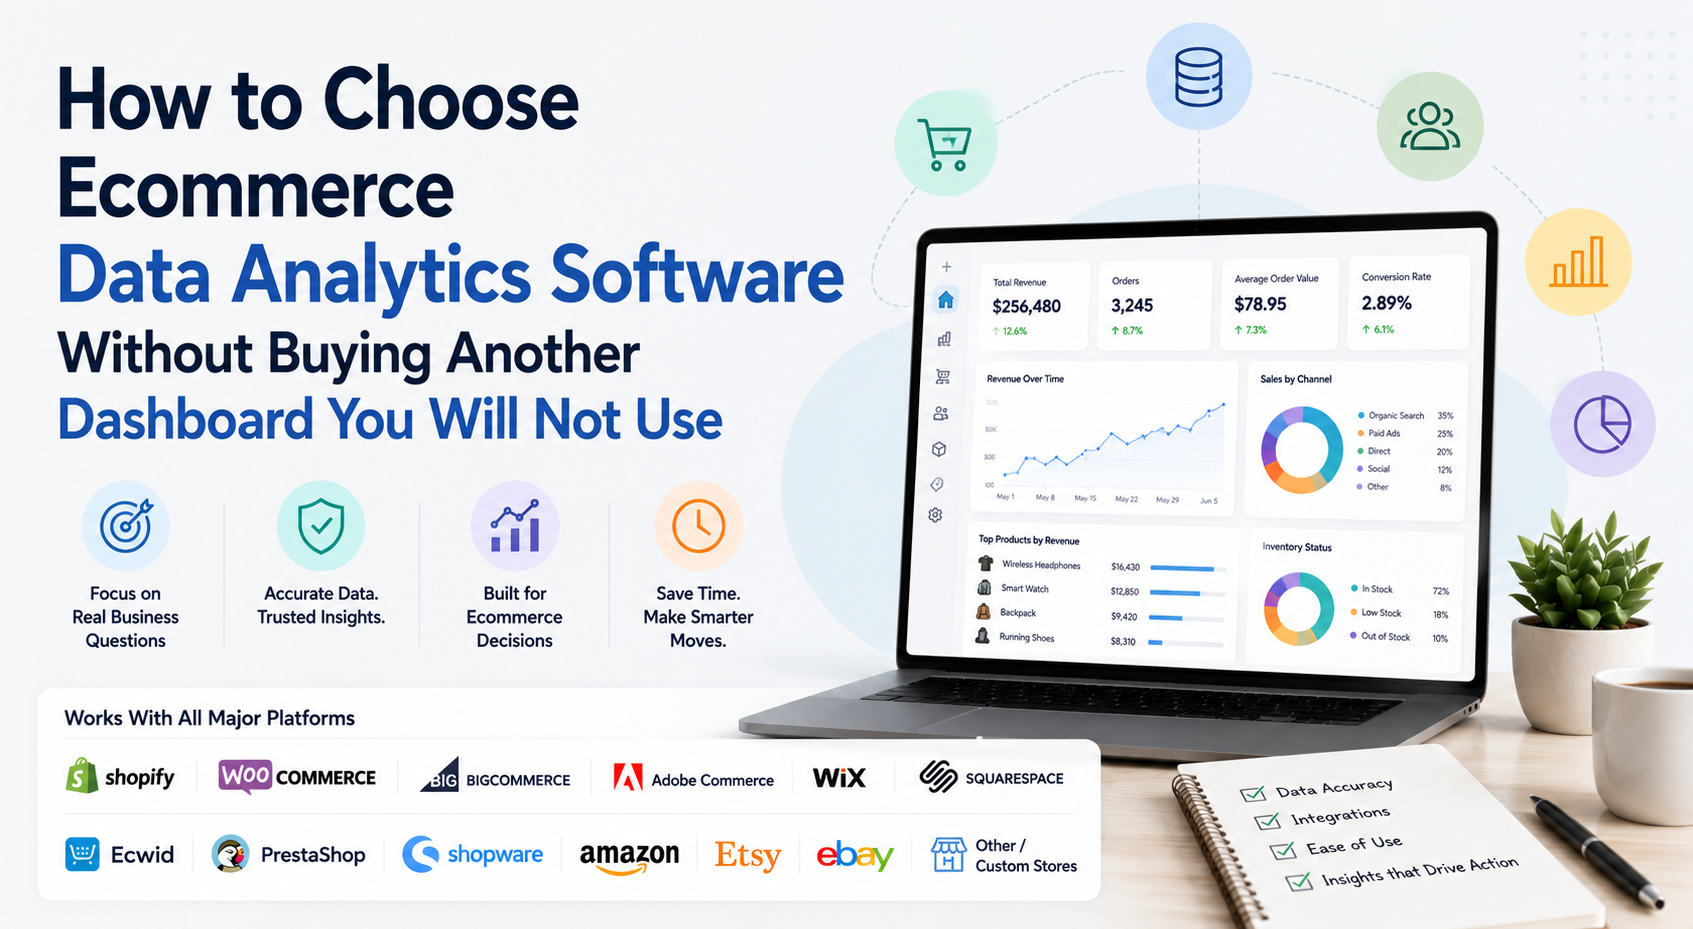
Even accurate data is not particularly useful when nobody on the team knows what to do with it. The right analytics software should reduce reporting work, make important changes easier to investigate and fit the way your ecommerce business actually operates.
Before Shopping for Software, Write Down the Problems You Need It to Solve
Do not start with product comparisons. Start with your current reporting problems. Maybe you spend hours combining exports every week. Perhaps sales are easy to see but difficult to explain.
Customer, inventory and product data may live in separate systems. You might operate several stores or marketplaces and struggle to compare them consistently. Write down the questions that currently take too much effort to answer. For example:
- Why did revenue change this week?
- Which products contributed most to the change?
- Are returning customers becoming more or less active?
- Which important products are at inventory risk?
- Where are shoppers dropping out before purchase?
- Are refunds concentrated around particular products?
- How does one store or marketplace compare with another?
- Which problems deserve attention first?
These questions become your buying criteria. If a product cannot answer them clearly, its other features matter much less. Our Ecommerce Data Analytics guide explains the major areas of ecommerce data that merchants commonly need to connect before making decisions.
Check What Your Current Platform Already Gives You
Before paying for another analytics product, understand the reporting you already have. Shopify currently provides customizable analytics dashboards, default reports, filters, dimensions, visualizations and custom data explorations. Its dashboard cards can also lead directly into more detailed reports.
WooCommerce Analytics similarly includes a customizable dashboard, detailed reports, filtering, segmentation and CSV downloads across areas such as customers, orders, products, revenue and stock.
Adobe Commerce Intelligence includes preconfigured dashboards and reports covering customer behavior, repeat purchasing, products and executive-level business performance. That means the first buying question should be: What can the new software do that our current reporting cannot do efficiently?
If the answer is only "it gives us another dashboard," you may be adding duplication rather than improving analytics. A third-party platform becomes more compelling when it connects data that is currently fragmented, improves cross-platform analysis, reduces manual preparation or provides analytical workflows your current platform does not handle well.
Decide Whether You Need Reporting or Actual Analysis
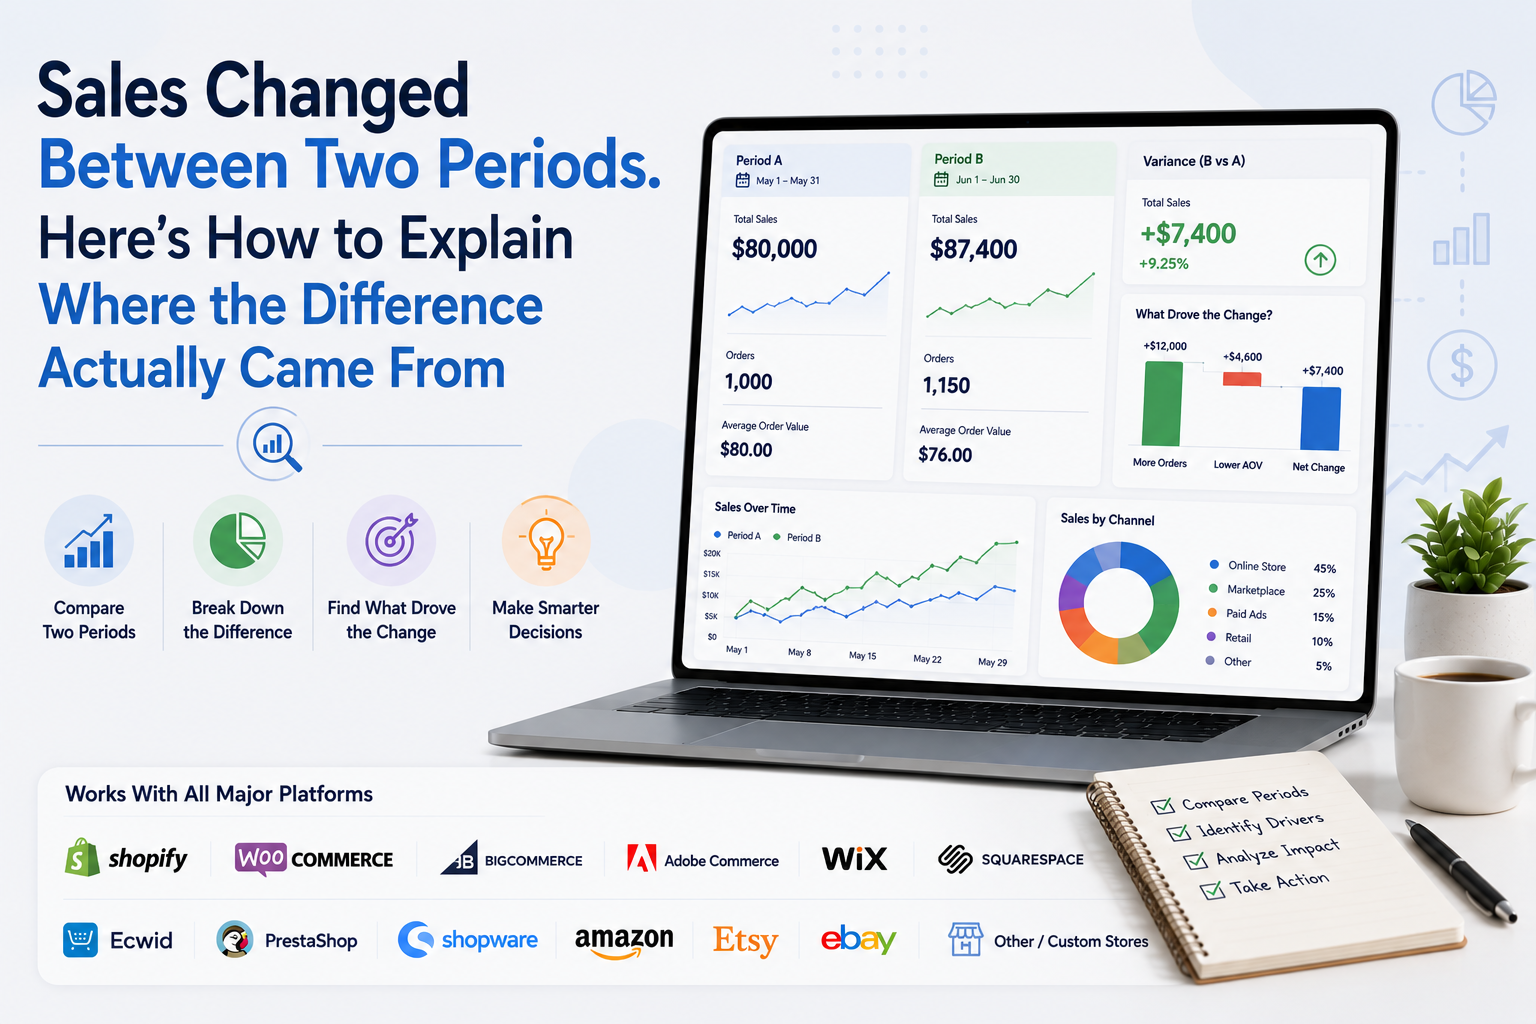
Reporting and analytics are related, but they are not identical. Reporting tells you: Revenue declined 11%. Analytics helps you investigate: Was the decline caused by fewer orders, lower average order value, weaker returning-customer activity, unavailable products or something else?
This difference should influence your software choice. If all you need is a scheduled spreadsheet containing sales totals, a reporting tool may be enough.
If your team regularly needs to move from a high-level change into customers, products, inventory, checkout activity and other related areas, look for software built for investigation rather than only presentation.
A useful test is to ask the vendor: When this dashboard tells me revenue dropped, what can I do next without leaving the platform? The answer tells you a lot about the depth of the product.
Data Coverage Should Follow Your Decisions
Do not choose software because it collects the largest number of metrics. Choose software that covers the data relationships relevant to your business. For many ecommerce stores, this can involve:
- Sales and orders: Revenue, transactions, average order value, discounts and period comparisons.
- Customers: New and returning buyers, retention, purchasing behavior and customer segments.
- Products: Revenue, units sold, product trends and important variants.
- Inventory: Available stock, stock risk, slow-moving products and stockouts.
- Purchase journey: Product engagement, cart activity, checkout and completed purchases where the platform exposes this information.
- Post-purchase activity: Refunds, returns and cancellations.
- Marketing and acquisition: Traffic, campaign or channel information when required.
Google Analytics, for example, can measure ecommerce interactions including product views, add-to-cart activity and purchases after the appropriate ecommerce events are implemented.
The important phrase is when required. You do not need every possible dataset inside one tool. You need the datasets required to answer the questions your team actually asks.
Make Sure the Software Supports Your Ecommerce Environment Properly
A logo on an integrations page does not tell you enough. Ask how deep the connection actually goes.
This becomes particularly important when comparing software for Shopify, WooCommerce, BigCommerce, Adobe Commerce, Wix, Squarespace, Ecwid, PrestaShop, Shopware, Amazon, Etsy, eBay and custom ecommerce systems.
Support can mean very different things. One integration may retrieve orders and revenue. Another may include customers, products, inventory, refunds and returns. A marketplace connection may expose different information from a direct ecommerce storefront.
A custom integration may require API development. Before buying, determine exactly which objects and historical records the connection provides. Ask questions such as:
- Does the integration include customers?
- Can it retrieve product-level performance?
- Does inventory sync?
- Are refunds and returns included?
- How much historical data can be imported?
- Can multiple accounts or stores be connected?
- What happens if the source API temporarily fails?
Do not evaluate integrations by logo count. Evaluate them by usable data depth.
Be Especially Careful With Multi-Platform Reporting
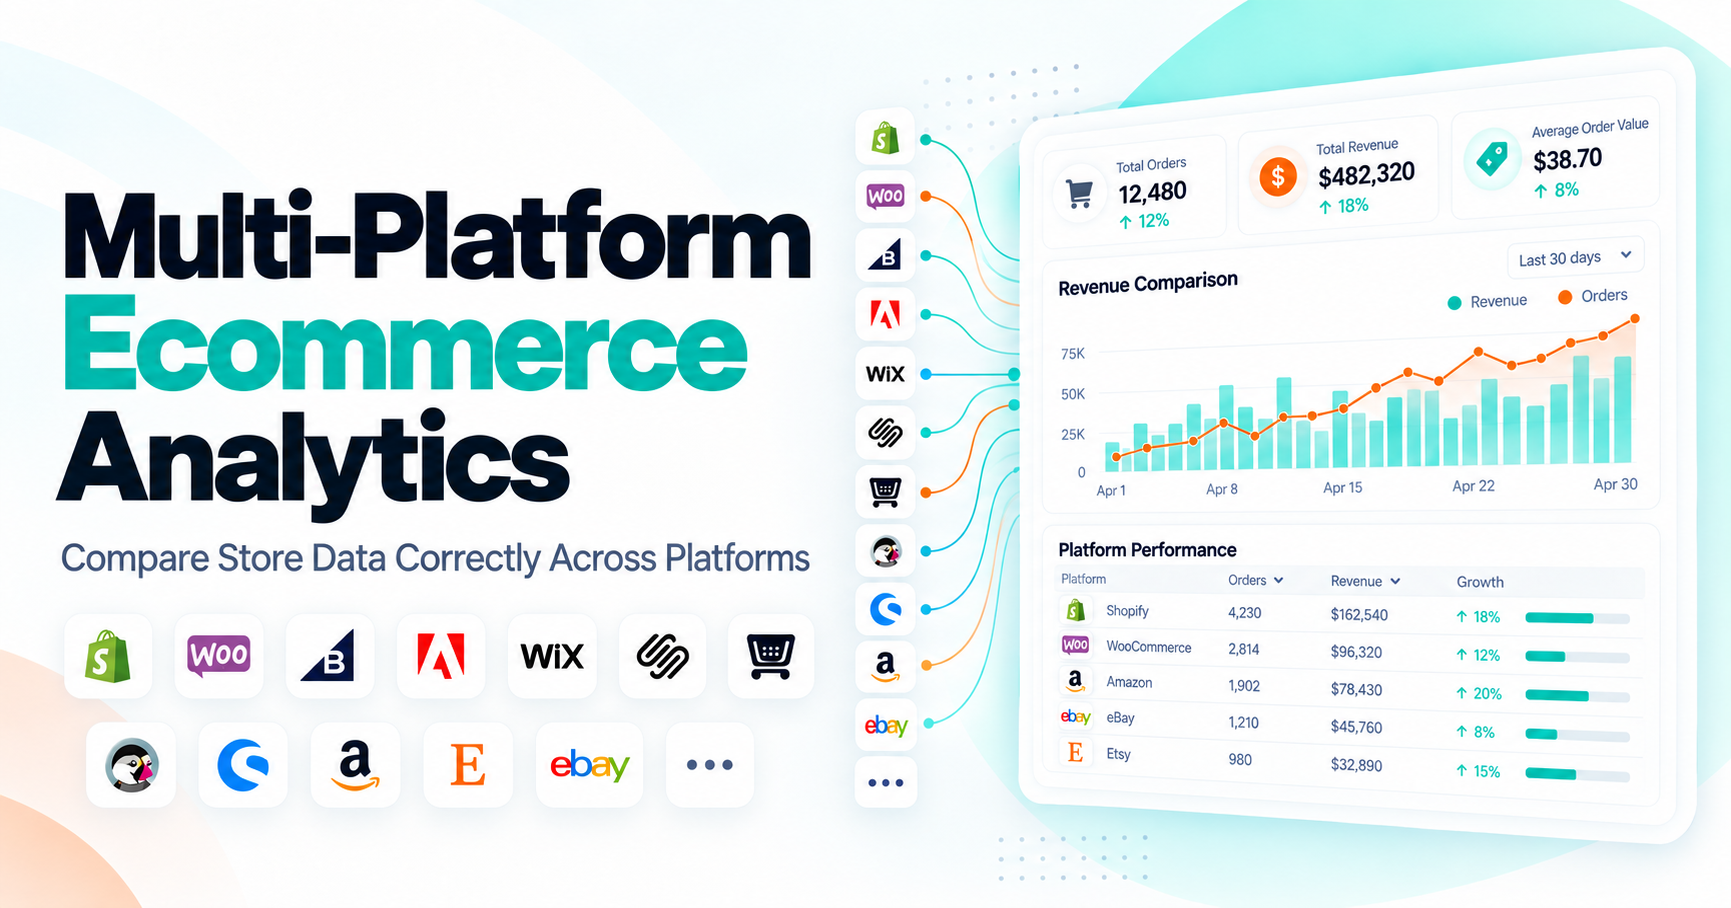
A business selling through several channels needs more than multiple connections. It needs comparable data. Imagine you operate your own ecommerce website, Amazon and eBay. Simply adding revenue from all three platforms may seem easy. But deeper analysis introduces questions:
- Are all values using the same currency?
- How are refunds treated?
- Which date determines the sale?
- Do product IDs match between systems?
- Can customers be identified consistently?
- Are taxes and shipping included in the same way?
- How are cancelled orders treated?
The more platforms you combine, the more important data normalization becomes. Ask the software vendor what happens after the integrations are connected. A useful multi-platform analytics product should have a clear method for turning different source structures into metrics that can actually be compared.
Metric Definitions Matter More Than Dashboard Design
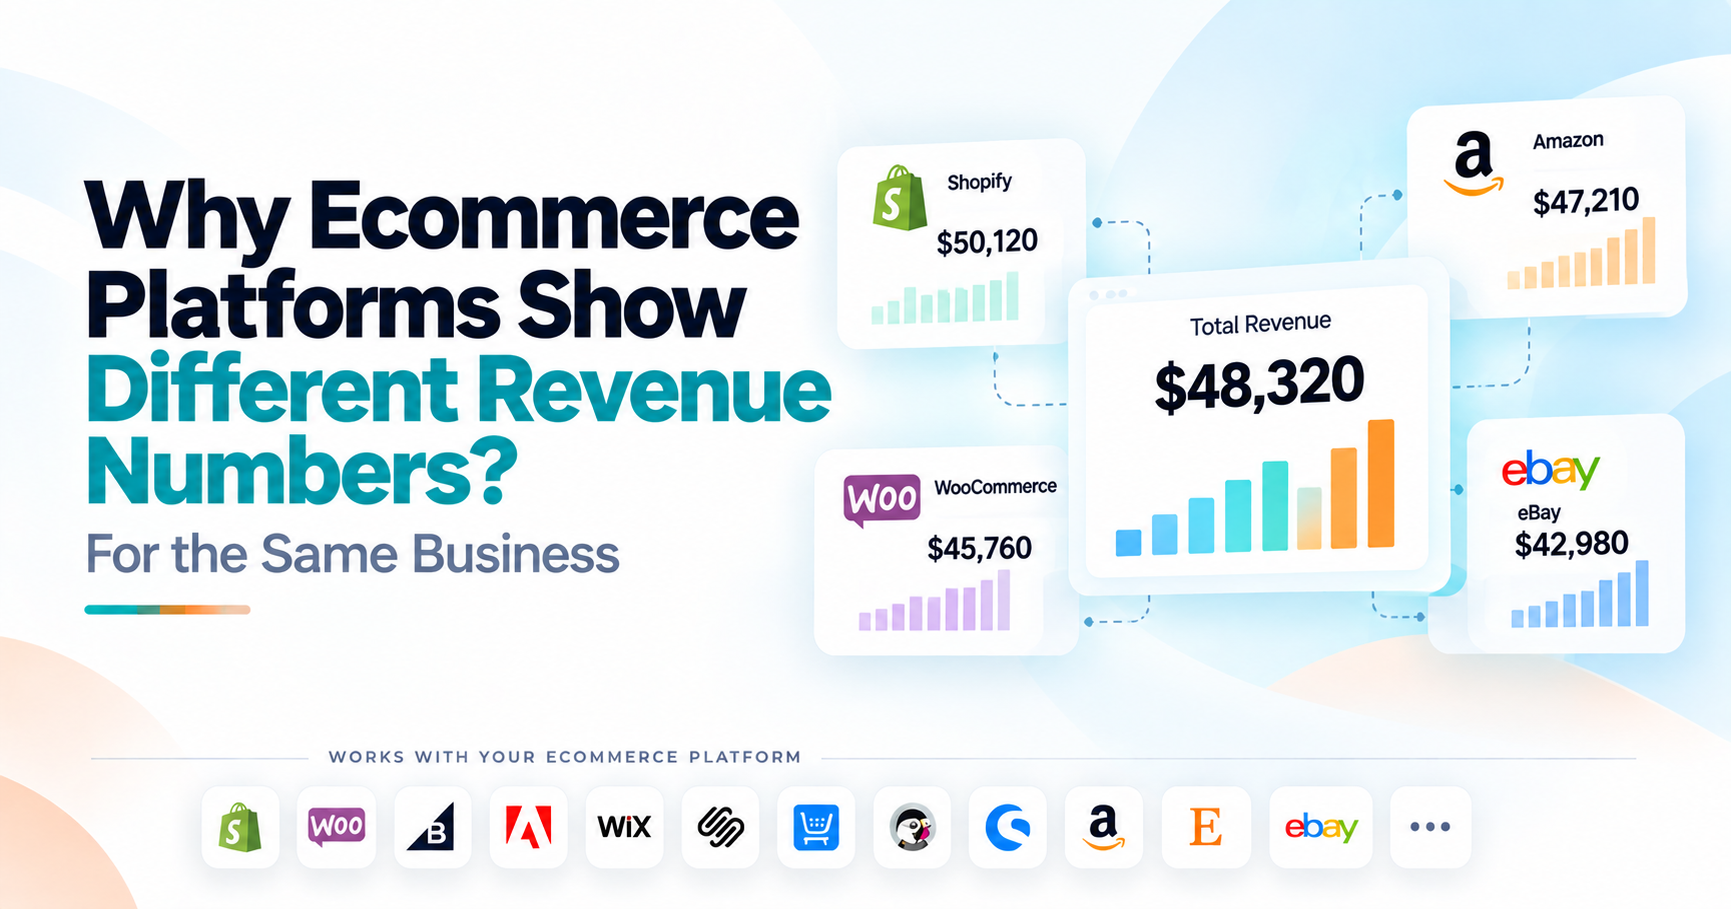
One of the fastest ways to lose confidence in analytics software is to see numbers that do not match your store. Sometimes the software is wrong. Sometimes both systems are correct but calculating different things.
WooCommerce, for example, separately defines gross sales and total sales, with returns, coupons, taxes and shipping affecting those calculations differently.
Shopify also provides many different sales and analytics fields rather than treating every commercial value as one universal "revenue" number. Before choosing software, find out how it defines important metrics. At minimum, you should understand:
- Which orders are included
- How cancelled orders are treated
- How refunds are applied
- Whether taxes and shipping are included
- How average order value is calculated
- How returning customers are defined
- Which date controls period reporting
- Which currency rules are used
A dashboard becomes much more trustworthy when you can explain where each important number came from.
Test Whether the Numbers Reconcile
Do not wait until after implementation to discover whether you trust the product. During a free trial or pilot, choose one completed period and compare the analytics platform with your source commerce system. Test several different areas. For example:
- Revenue.
- Orders.
- One major product.
- Refund activity.
- Customer count.
- Inventory on several selected SKUs.
Do not expect every number across every platform to match automatically if definitions differ. But you should be able to explain the differences. The dangerous situation is:
- Store: $120,000 revenue
- Analytics software: $113,400
- Vendor explanation: We are not sure.
If the system cannot explain core reconciliation differences during evaluation, do not assume the problem will disappear later.
Data Freshness Should Match the Decision
Another common software comparison mistake is chasing "real-time analytics" without asking whether real time is actually needed. Some decisions require fresh information. A payment problem, sudden checkout failure or high-impact stockout may need quick visibility.
Customer retention analysis does not normally require second-by-second updates. Shopify's current Analytics dashboard updates key sales, sessions and fulfillment metrics within about one minute.
WooCommerce uses analytics caching and periodically updates processed report data, with tools available to rebuild analytics data when figures appear incorrect. Different systems therefore have different freshness models. Ask potential vendors:
- How frequently does each data source refresh?
- Does refresh speed vary by integration?
- Can I see when the data last synced?
- What happens after a failed sync?
- Can historical data change after refunds or adjustments arrive?
You do not need the fastest possible refresh. You need data fresh enough for the decisions you are making.
Historical Data Is More Important Than It First Appears
A new dashboard might look excellent during the demo. Then you install it and discover it has only a few weeks of history. That becomes a problem when you want to understand:
- Seasonality.
- Year-over-year trends.
- Long-term retention.
- Customer cohorts.
- Product lifecycle.
- Recurring stock problems.
- Previous promotional periods.
Before selecting ecommerce data analytics software, ask exactly how much historical information can be imported for each integration. Also determine whether historical depth varies by pricing plan.
A growing store might be satisfied with several months today but need years of comparison data later. Think about the next stage of the business rather than only today's reporting needs.
Look for Drill-Down, Not Just KPI Cards
A KPI card tells you: Orders down 16%. Useful analytics lets you investigate the change.
- Can you move from orders into products?
- From products into inventory?
- From overall customers into new and returning buyers?
- From refunds into the products responsible?
- From a store-level decline into individual sales channels?
That movement between overview and detail is one of the most important capabilities to test. Shopify itself follows this approach by linking dashboard metric cards with underlying reports that provide deeper analysis. Your analytics software should similarly make the next question easier to answer. Otherwise, it is mainly a prettier reporting screen.
Filters Need to Work Consistently
Filters are easy to overlook during a product demo. They become extremely important during real analysis. You may need to filter by:
- Date.
- Store.
- Marketplace.
- Product.
- Customer type.
- Sales channel.
- Country.
- Location.
- Category.
- Order status.
The important part is not simply having filters.
- It is knowing whether they affect the entire analytical view consistently.
- If you select one store, does every relevant card update?
- If you choose a date range, do customer, product and inventory sections follow it logically?
- If one chart ignores a filter because of a different underlying data model, users can easily compare incompatible information.
Test filtering during the trial with actual analytical questions, not random clicking.
Do Not Buy AI Without Testing It on Your Own Data
Many analytics products now promote AI features.
- The useful question is not: Does it have AI?
- Ask: What exactly can the AI do with our business data?
A useful analytics assistant might help you investigate questions such as:
- Why did revenue change last week?
- Which products contributed most to the decline?
- Did returning or new customers drive growth?
- Which strong-selling products are currently becoming low in stock?
The answer should be grounded in connected data. It should also allow you to verify the underlying numbers. An AI system should not confidently invent a business cause when the available data only shows correlation.
For example, if revenue falls at the same time that stockouts rise, the software can highlight the relationship.
It should not automatically claim stockouts caused the entire revenue decline unless the data supports that conclusion. Good AI reduces investigation time. Bad AI simply generates confident commentary beside a chart.
Ask Whether You Can Get the Data Back Out
You should also consider what happens when the dashboard is not enough.
- Can you export detailed records?
- Can reports be downloaded?
- Can results be shared with finance?
- Is there an API?
- Can the data feed another BI system later?
Shopify's reporting environment, for example, supports report exports for further analysis, while WooCommerce provides CSV downloads from its analytics reports. Exportability matters because your reporting needs will change.
You may eventually need financial modeling, a custom forecast, a board report or a specialized investigation that the analytics interface was not designed to perform. Choosing analytics software should not mean trapping your business inside one dashboard.
Understand Whether You Need Alerts
Dashboards require someone to open them. Alerts can bring attention to specific conditions without requiring constant monitoring. This can be useful for areas such as:
- Low stock.
- Out of stock products.
- Large sales changes.
- Unusual refunds.
- Customer retention deterioration.
- Checkout problems.
- But alerts only help when they are meaningful.
If the application sends twenty warnings every day, your team will probably start ignoring them. Ask whether alerts can be prioritized, configured or connected to business impact.
A high-revenue bestseller approaching stockout should normally deserve more attention than a slow-moving SKU reaching the same quantity. The goal is not maximum notification volume. It is earlier awareness of issues that matter.
Examine Permissions and Data Access Before Installation
Analytics software needs access to store data to perform analysis. That does not mean every permission request is automatically appropriate. Review which information the application can read and whether it can modify anything. Ask:
- Which customer data does it access?
- Does it read order information?
- Does it require inventory access?
- Can it modify products or store settings?
- How is information transmitted?
- How long is it retained?
- What happens after disconnection?
- Who within your company can access the analytics platform?
Security should be part of software evaluation, not something checked after procurement. The more stores, marketplaces and systems you connect, the more important this becomes.
Think About Who Will Actually Use the Software
The most sophisticated analytics platform in your shortlist may still be the wrong choice. Consider the people using it. A founder may want a quick view of the business and plain-language explanations.
A marketing manager may want acquisition and conversion breakdowns. An inventory manager may focus on products and availability. An analyst may want exports and deeper filtering. Executives may only want major trends and exceptions.
If the system requires technical skills that your actual users do not have, adoption will suffer. During evaluation, let the people who will use the product test it. Do not let software procurement become a decision made entirely from a vendor demonstration.
How Much Customization Do You Really Need?
Customization sounds positive because it creates flexibility. It can also create maintenance. If every report, metric and dashboard needs to be built from scratch, you may be moving closer to a business intelligence project than a ready-to-use ecommerce analytics product.
For many merchants, the ideal balance is: Useful ecommerce reporting works immediately, but deeper customization remains available when needed.
If your company needs complete control over semantic models, complex cross-department calculations and enterprise data architecture, a general BI platform may be more appropriate.
Our article on ecommerce analytics software vs business intelligence tools covers that architectural choice in more detail. The question here is whether your store genuinely needs that flexibility or would simply end up rebuilding standard ecommerce reports yourself.
Do Not Judge Pricing by the Lowest Monthly Plan
A $29 analytics product is not necessarily cheaper than a $99 product. Suppose the cheaper system lacks inventory analytics, so you keep a second application. It cannot combine marketplaces, so you continue manually preparing spreadsheets.
Historical data is limited, so long-term comparisons require exports. The actual cost is no longer $29. Compare total cost across:
- Software subscription.
- Additional applications required.
- Historical data limits.
- Number of stores.
- Users.
- AI usage.
- Data refresh limits.
- Implementation time.
- Ongoing manual work.
- Training.
A more expensive analytics platform can sometimes reduce total reporting cost. An inexpensive platform can still be the better choice when it covers everything your business actually needs. Do not optimize for the smallest invoice. Optimize for the most useful reporting system at a sensible total cost.
A Free Trial Should Be a Test, Not a Tour
One of the best ways to evaluate ecommerce analytics software is to stop exploring the interface randomly. Enter the trial with a list of real questions. Try to answer them. For example:
- Why was revenue different last week?
- Which products created most of the change?
- Did new or returning customers drive that result?
- Are any important products currently at inventory risk?
- Can I compare this month with the previous comparable period?
- Can I verify the numbers against my ecommerce platform?
- Can I export the result?
- Can another person on the team understand the dashboard without my help?
Then measure the time it takes. If your existing process requires 45 minutes and the software gets you to a reliable answer in five, you have evidence of value.
If it still requires multiple exports, manual reconciliation and another application, you may simply have purchased another place to look at data.
Run One Real Investigation Before Buying
Feature demonstrations are designed to look clean. Real stores are messy. Use the trial to investigate an actual event from your business. Perhaps revenue dropped two weeks ago. Try to determine:
- Was traffic different?
- Did order count change?
- Did average order value change?
- Which products moved?
- Was inventory involved?
- Did customer mix shift?
- Did refunds change?
You do not need every one of those answers from one system. The objective is to see whether the platform meaningfully shortens the investigation.
A strong analytics product should help you move from: Something changed to: This is the part of the business we need to examine. That is much more important than how impressive the demo dashboard looks.
Create a Simple Software Scorecard
When several products look similar, score them against your actual requirements. A practical evaluation might use these categories:
| Area | Weight |
|---|---|
| Required platform integrations | 20% |
| Accuracy and metric definitions | 15% |
| Data coverage | 15% |
| Investigation and drill-down | 15% |
| Ease of use | 10% |
| Historical data | 5% |
| Data freshness | 5% |
| Export and interoperability | 5% |
| Security and permissions | 5% |
| Total cost | 5% |
The exact weights should reflect your business. A marketplace-heavy retailer may give integrations much more weight. A large team may care more about user permissions.
A smaller merchant may prioritize ease of use and price. The value of the scorecard is not mathematical precision. It stops one flashy feature from controlling the whole purchasing decision.
What Are the Biggest Warning Signs?
Be cautious when software:
- Cannot explain how important metrics are calculated
- Produces numbers that cannot be reconciled with source data
- Advertises many integrations without explaining data depth
- Hides historical-data limitations
- Provides no clear export route
- Uses AI that gives generic ecommerce advice rather than data-grounded analysis
- Requests permissions that seem unrelated to analytics
- Requires significant manual work to maintain ordinary reports
- Makes pricing difficult to understand
- Has an impressive dashboard but weak investigation capability
None of these automatically proves the software is poor. They are reasons to ask more questions before committing.
Should a Small Store Buy Ecommerce Analytics Software?
Not necessarily. If your native platform reports answer your questions and you can review the business without significant manual work, another tool may not provide enough additional value.
A smaller store should consider dedicated analytics when a clear reporting problem appears. Perhaps several data sources need to be connected. Maybe the owner repeatedly exports spreadsheets.
Perhaps customer, product and inventory relationships are difficult to investigate. The trigger should be reporting complexity, not the belief that every growing ecommerce store needs another application.
When Should a Larger Business Look Beyond Ecommerce Analytics Software?
A company may eventually reach the point where ecommerce is only one part of its analytical environment. Finance, ERP, procurement, CRM, wholesale, manufacturing or physical retail data may need to be modeled together.
At that point, a broader BI architecture can become more appropriate. That does not make ecommerce analytics software obsolete. Some businesses use a commerce-focused platform for operational store intelligence and a BI environment for enterprise reporting.
Choose the architecture based on the questions being asked. Do not adopt enterprise complexity before the business needs it.
Platform Choice Changes the Data, Not the Evaluation Principles
The same selection framework applies to businesses operating through Shopify, WooCommerce, BigCommerce, Adobe Commerce, Wix, Squarespace, Ecwid, PrestaShop, Shopware, Amazon, Etsy, eBay and custom ecommerce environments.
However, the information available from each source can differ. An independent ecommerce site may provide detailed customer and buying-journey information. A marketplace may expose different listing, advertising, transaction and customer data.
A custom storefront may require its own integration work. This is why "supports our platform" should never be the end of the integration conversation. Ask: What usable information will we actually receive from that platform?
Where Statty AI Fits
Statty AI is built around the idea that merchants should be able to understand important ecommerce signals without manually piecing together disconnected reports.
The current public product focuses on connected store intelligence around areas such as sales, customers, products, inventory and operations, with plain-English AI insights layered on top. Its public site currently identifies Shopify as live and states that additional commerce and business-system integrations are being added.
You can explore Statty AI analytics features or visit Statty AI when evaluating whether its approach matches the reporting problems your business is trying to solve. The important comparison is not: Does Statty AI have more charts than another platform?
It is: Can it reduce the time between seeing an important change and understanding where that change came from? That is the standard any ecommerce analytics platform should be judged against.
Final Thoughts
Choosing ecommerce data analytics software should not begin with feature count. Begin with the questions your business struggles to answer. Check what your existing platform already provides.
Then evaluate whether the new software improves data coverage, integration depth, metric consistency, historical analysis, drill-down, freshness, exports, permissions and actual usability.
Test the product with your own data. Reconcile the numbers. Ask real business questions. Make people from your actual team use it. And calculate the total cost, including the manual work the software does or does not remove.
Most importantly, do not buy analytics software because your store has a lot of data. Buy it when the software makes that data easier to trust, easier to investigate and easier to turn into a decision.