Shopify Analytics, SEO & Growth Guides for Merchants
Explore practical Shopify guides covering ecommerce analytics, customer behavior, product performance, inventory, checkout recovery, SEO and AI-powered reporting. Each article helps merchants understand store performance and make better-informed growth decisions.
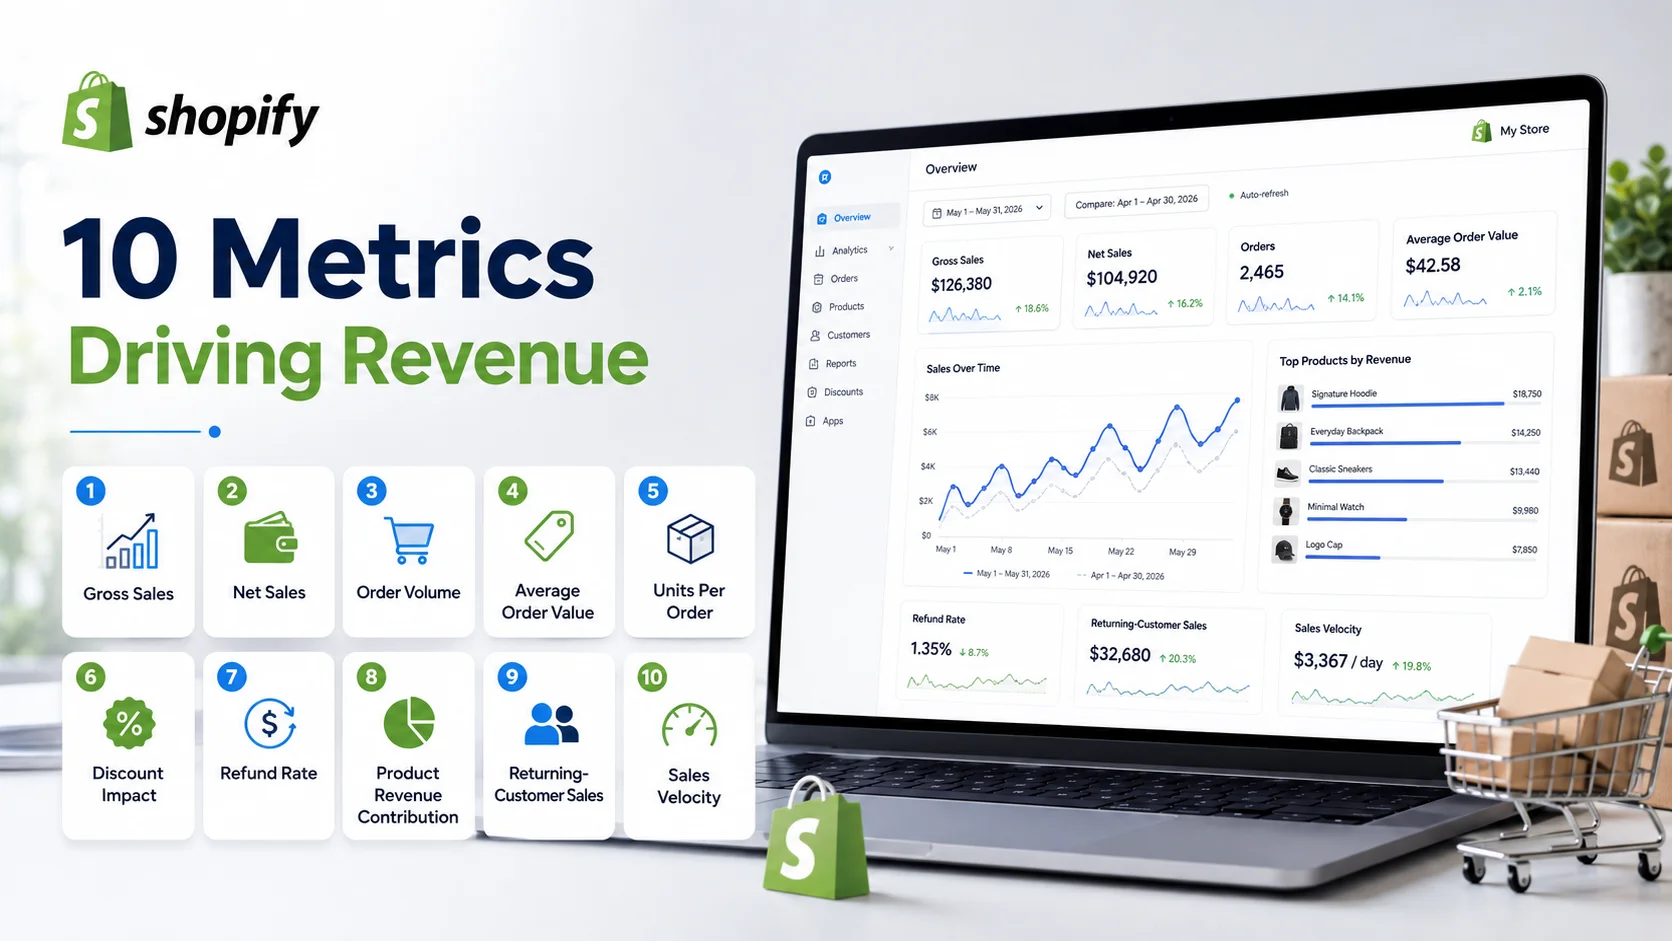
Learn which ecommerce metrics to check every week, how to compare them correctly, and when sales, customers, inventory or checkout data need attention.
Online store sales suddenly dropped? Learn how to check traffic, conversion, order value, inventory, checkout, customers and tracking before making changes.
Your store generates endless data, but not every number deserves attention. Learn which ecommerce metrics actually matter and how to choose them by decision.
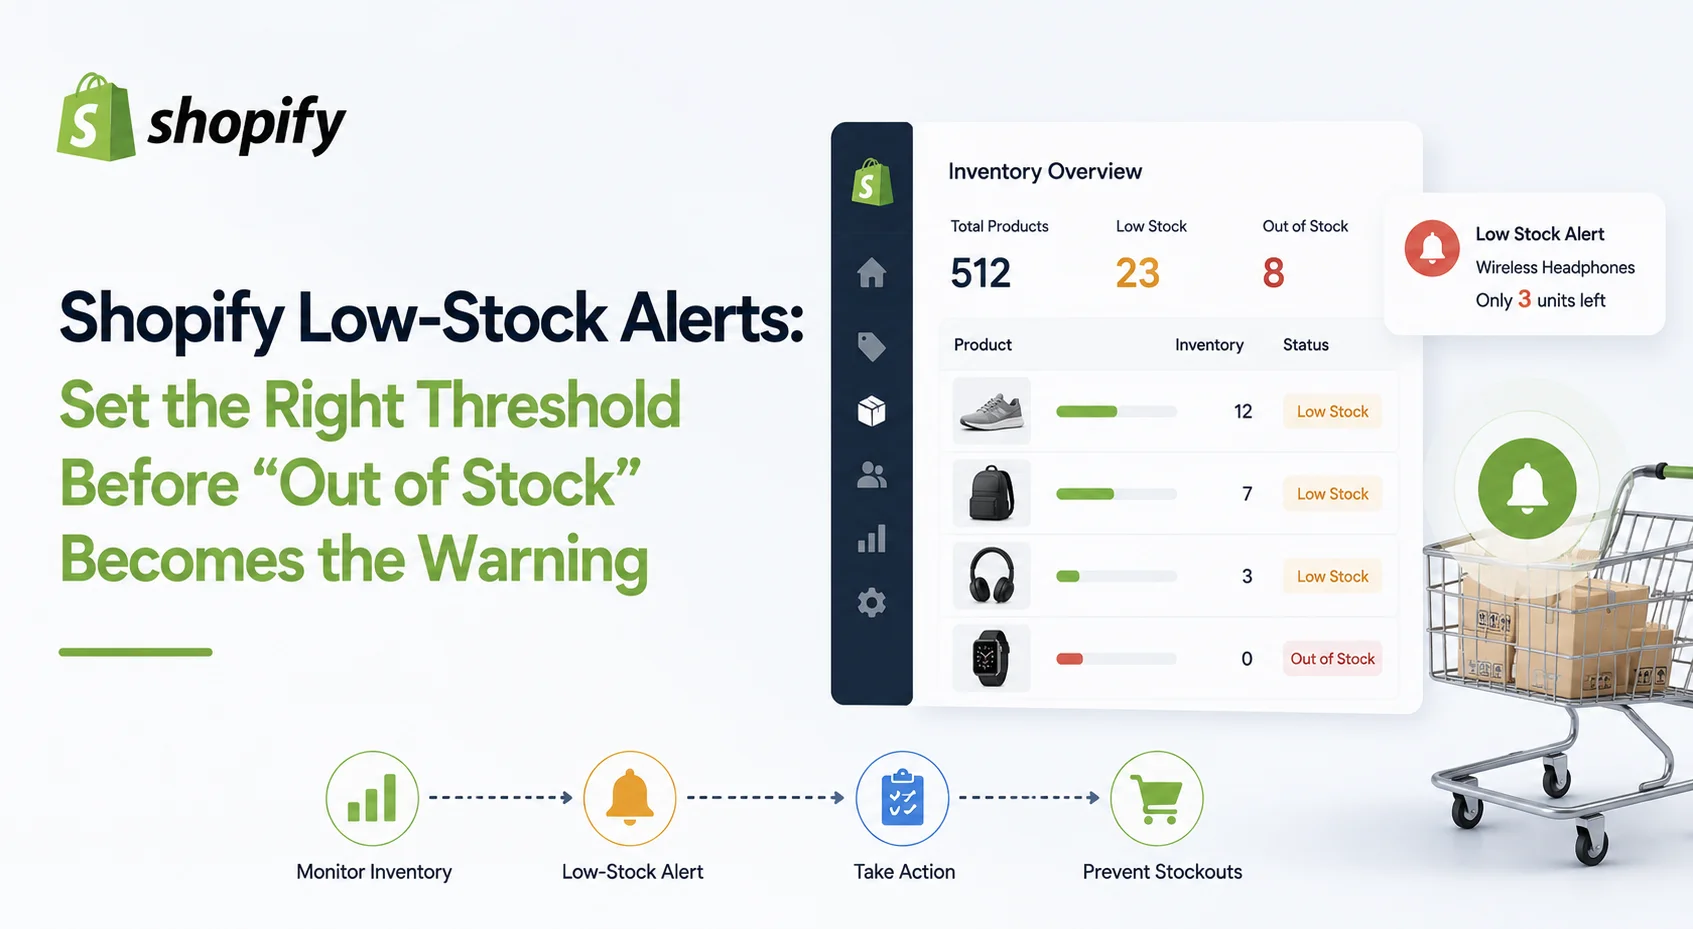
A low-stock alert that arrives after you have only two units left is not very useful if your supplier needs three weeks to deliver more inventory. The same alert may be unnecessarily early for a product that sells once every two months. That is the problem with treating “low stock” as one universal number. A useful Shopify low stock alert should warn you early enough to take action, but not so early that your team starts ignoring notifications. The right threshold depends on how quickly a product sells, how long replenishment takes, how much uncertainty exists and how important the item is to your store. Shopify lets merchants track inventory by product variant and location. For direct low-stock notifications, Shopify currently recommends using Shopify Flow or an inventory-alert app. The real work, however, is deciding when that notification should be triggered.
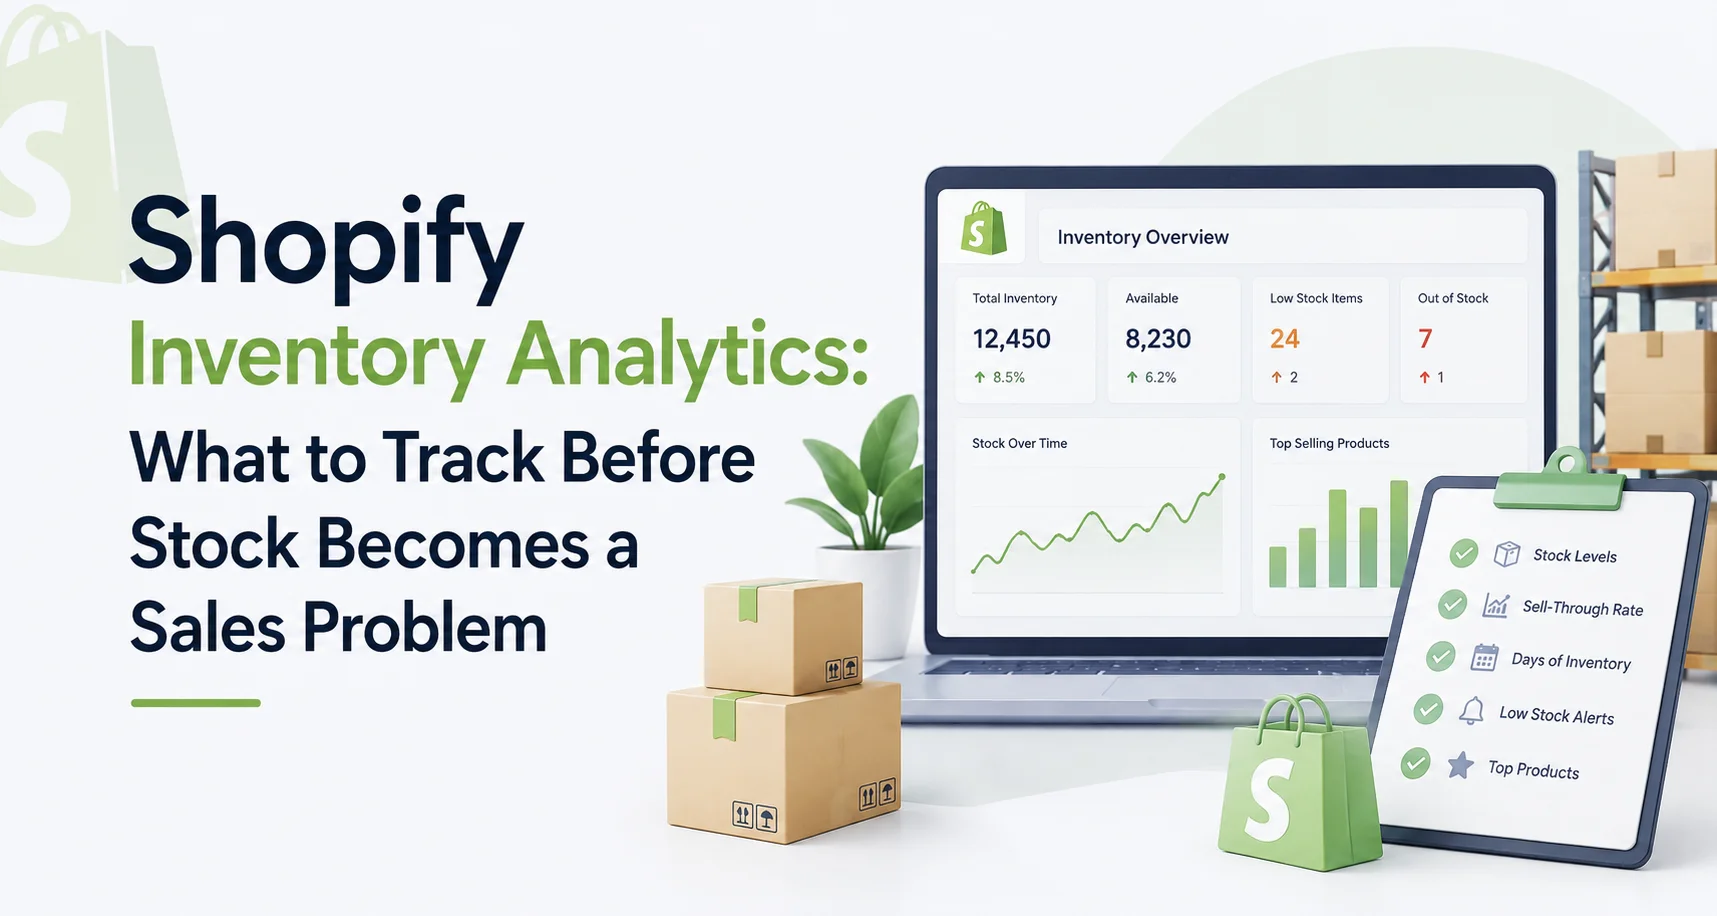
Having inventory in Shopify does not automatically mean you have the right inventory. You can have thousands of units sitting in a warehouse and still run out of the products customers actually want. Another product may look healthy because 100 units remain, but if it sells 20 units a day, that stock will not last long. This is where Shopify inventory analytics becomes useful. Instead of asking only, “How many units do we have?”, inventory analysis helps merchants answer better questions: How quickly is this product selling? How long will the remaining stock last? Which products contribute most to revenue? Which items are tying up inventory without moving? And which products could become unavailable before the next shipment arrives? Those are the questions that turn stock data into inventory decisions.
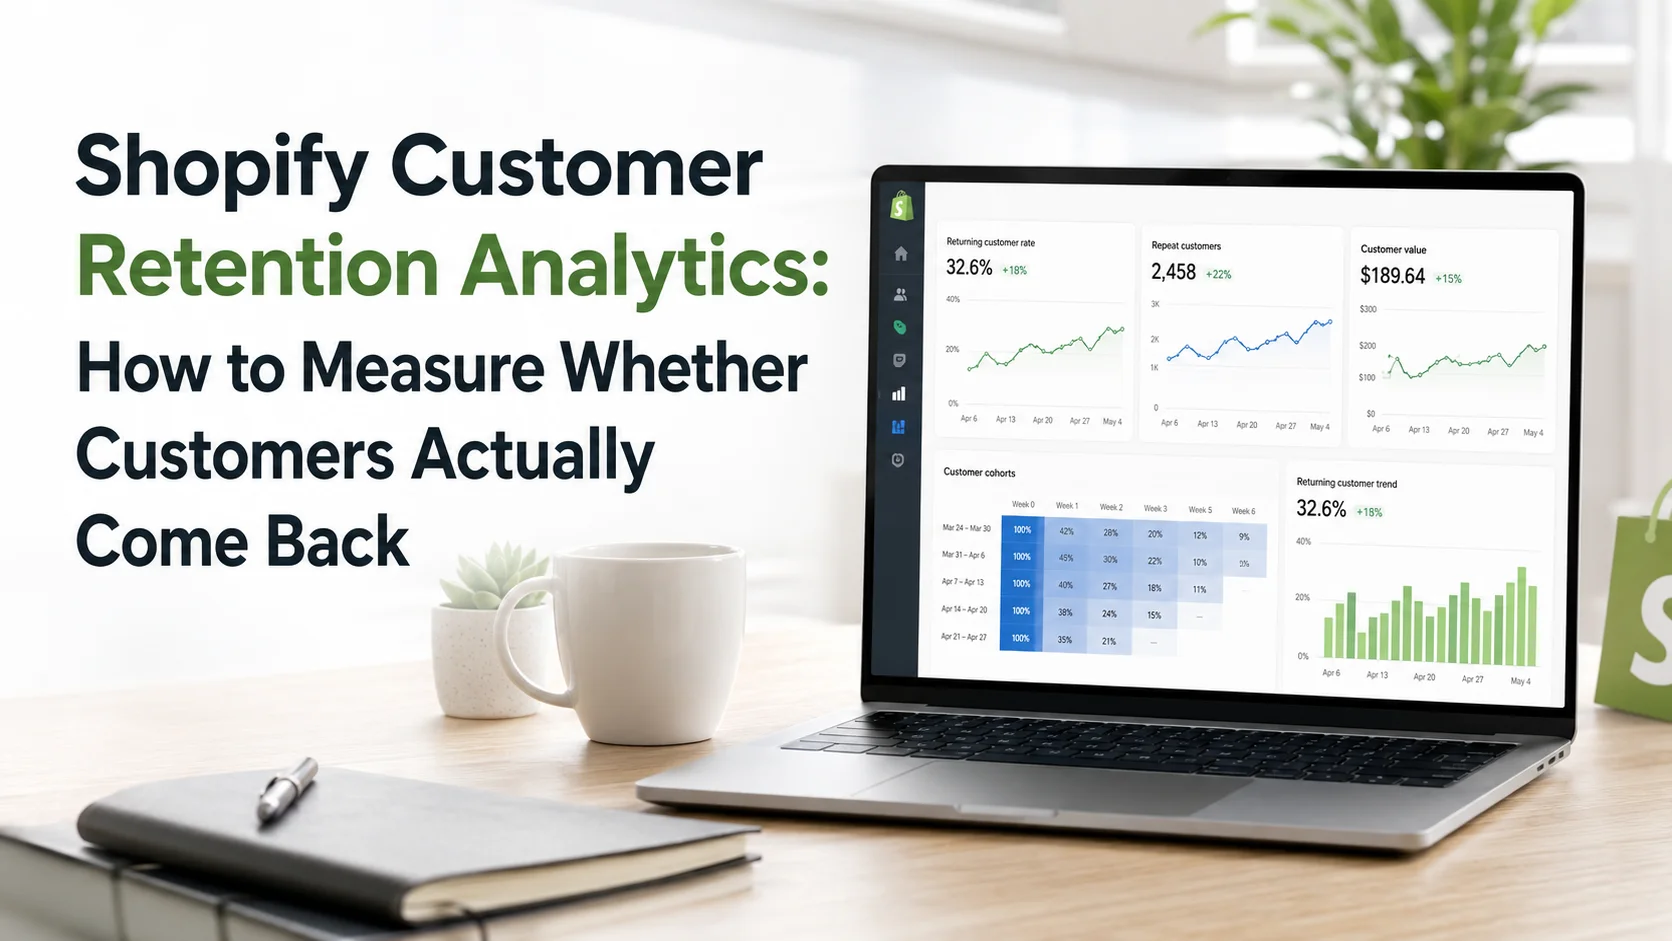
Getting a customer to place a first order is only one part of ecommerce growth. The harder question is what happens afterward. Do customers return? How quickly? Do they continue spending? Are newer customers behaving better or worse than customers acquired six months ago? That is what Shopify customer retention analytics should help you understand. Retention is not simply the percentage of customers who have purchased before. A useful analysis considers when customers first purchased, how much time they have had to return, how often they repurchase and how much revenue those returning relationships create. If you measure retention without considering those factors, the number can easily tell the wrong story.
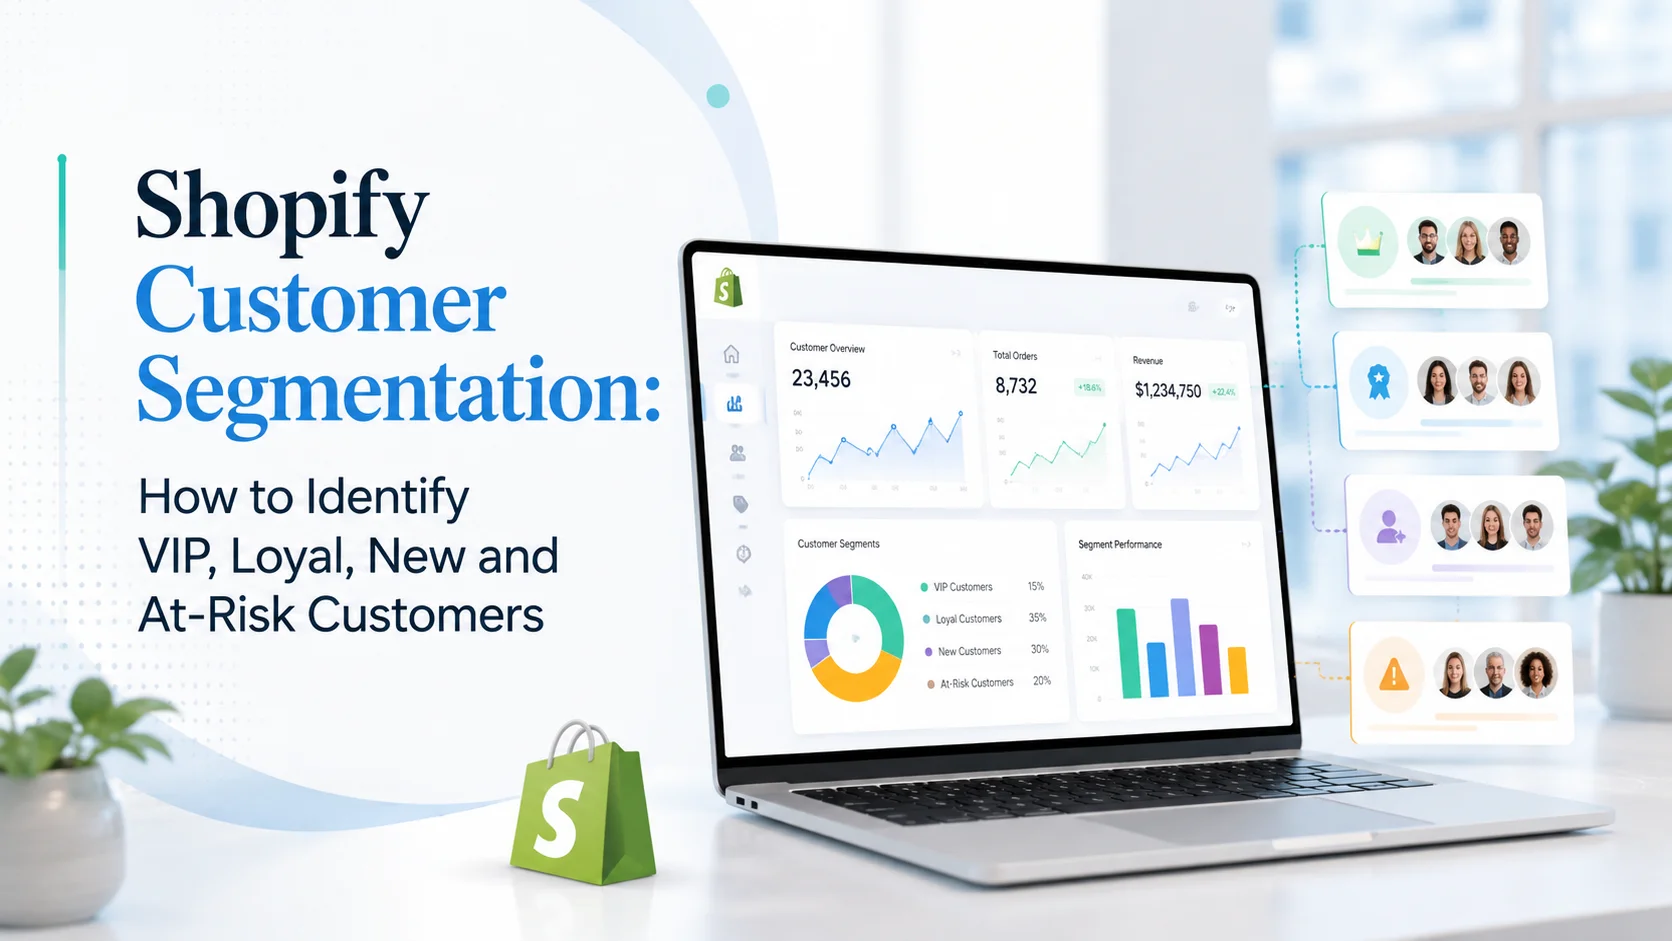
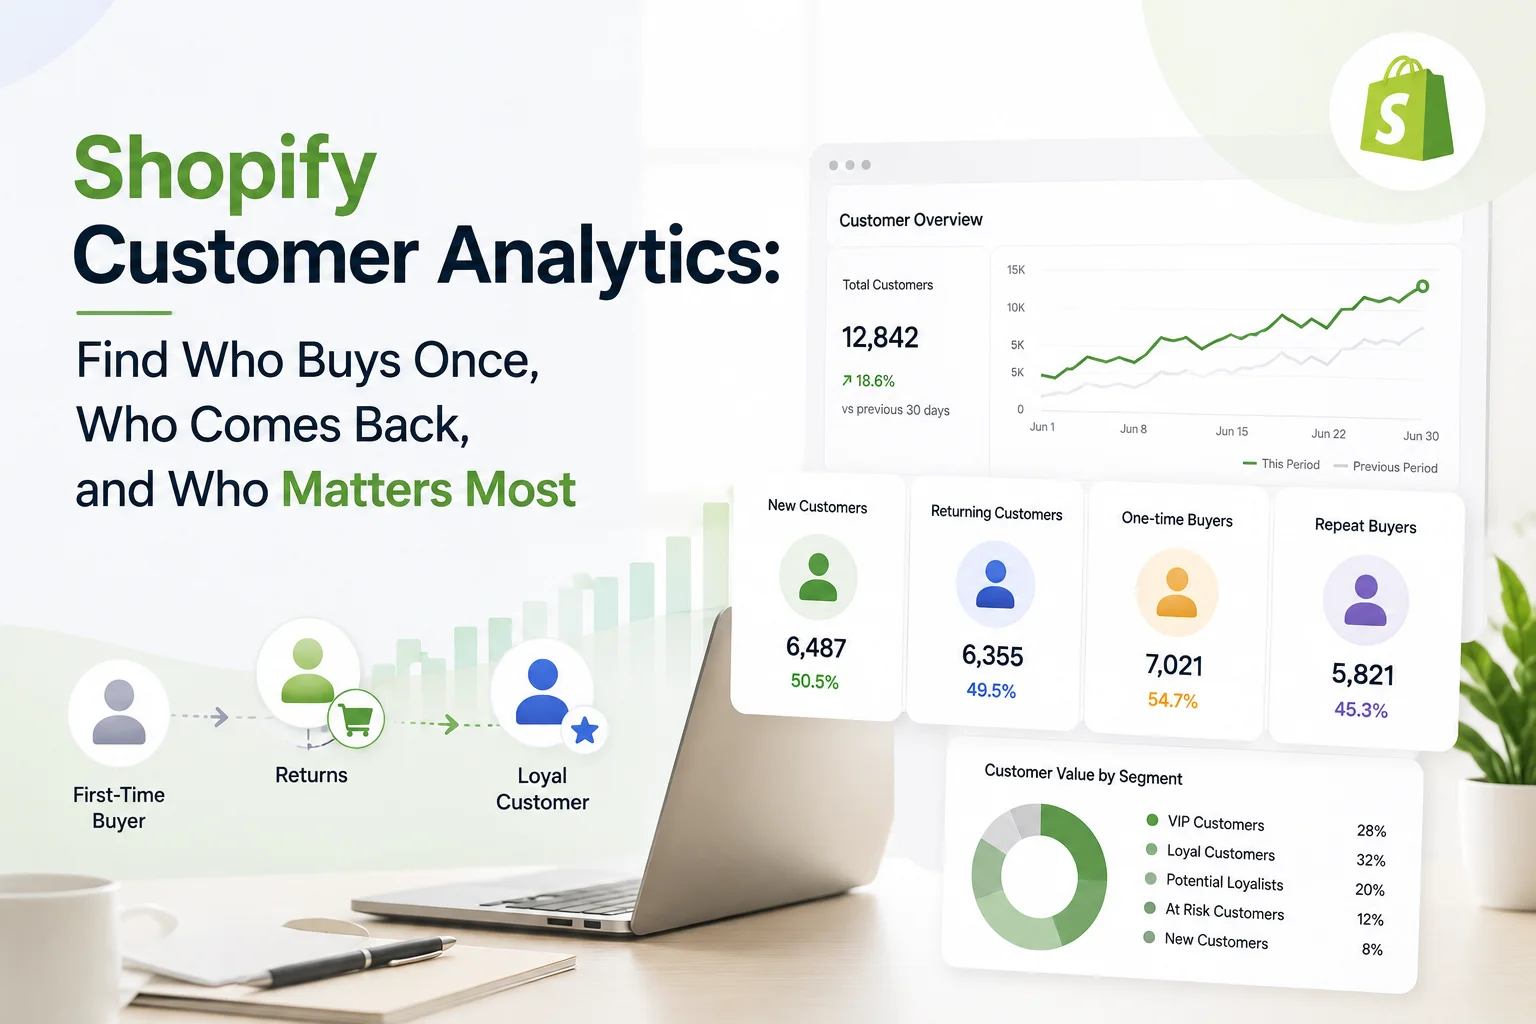
Not every customer should be treated the same. Someone who placed their first order yesterday has a very different relationship with your store from a customer who has purchased ten times over two years. A high-spending customer who has stopped ordering also needs a different approach from someone who bought once and never returned. That is the purpose of Shopify customer segmentation.
A store can add hundreds of new customers and still have a customer problem. That happens when people buy once and disappear. t can also happen when total customer revenue looks healthy but a small group of loyal buyers is quietly becoming less active.
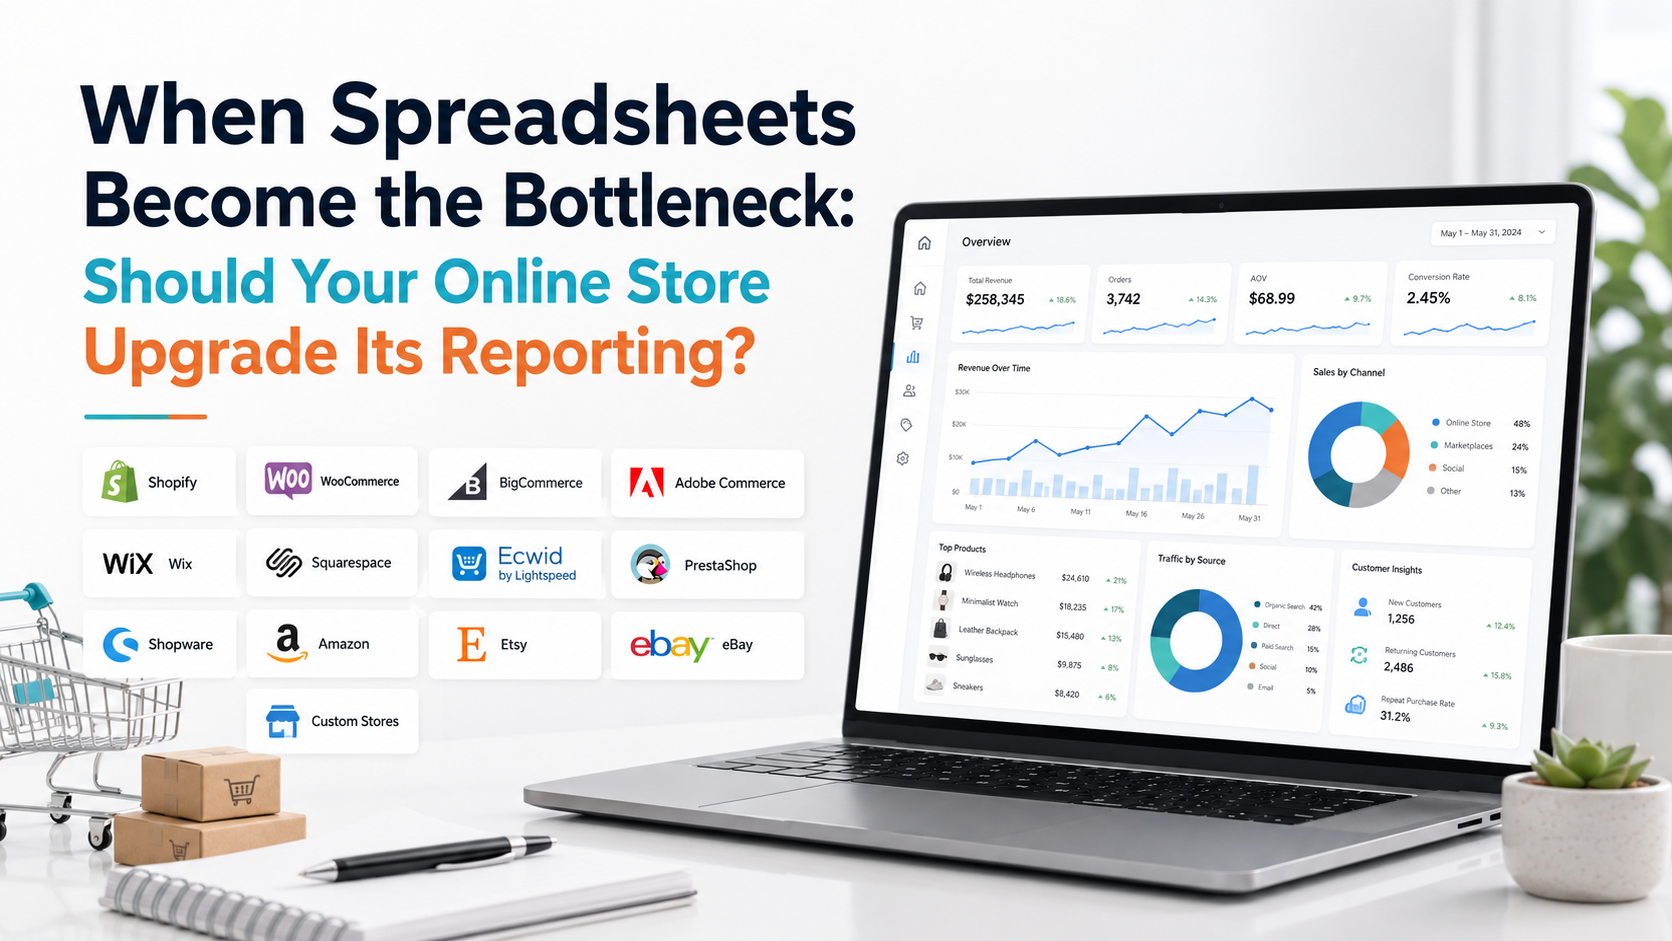
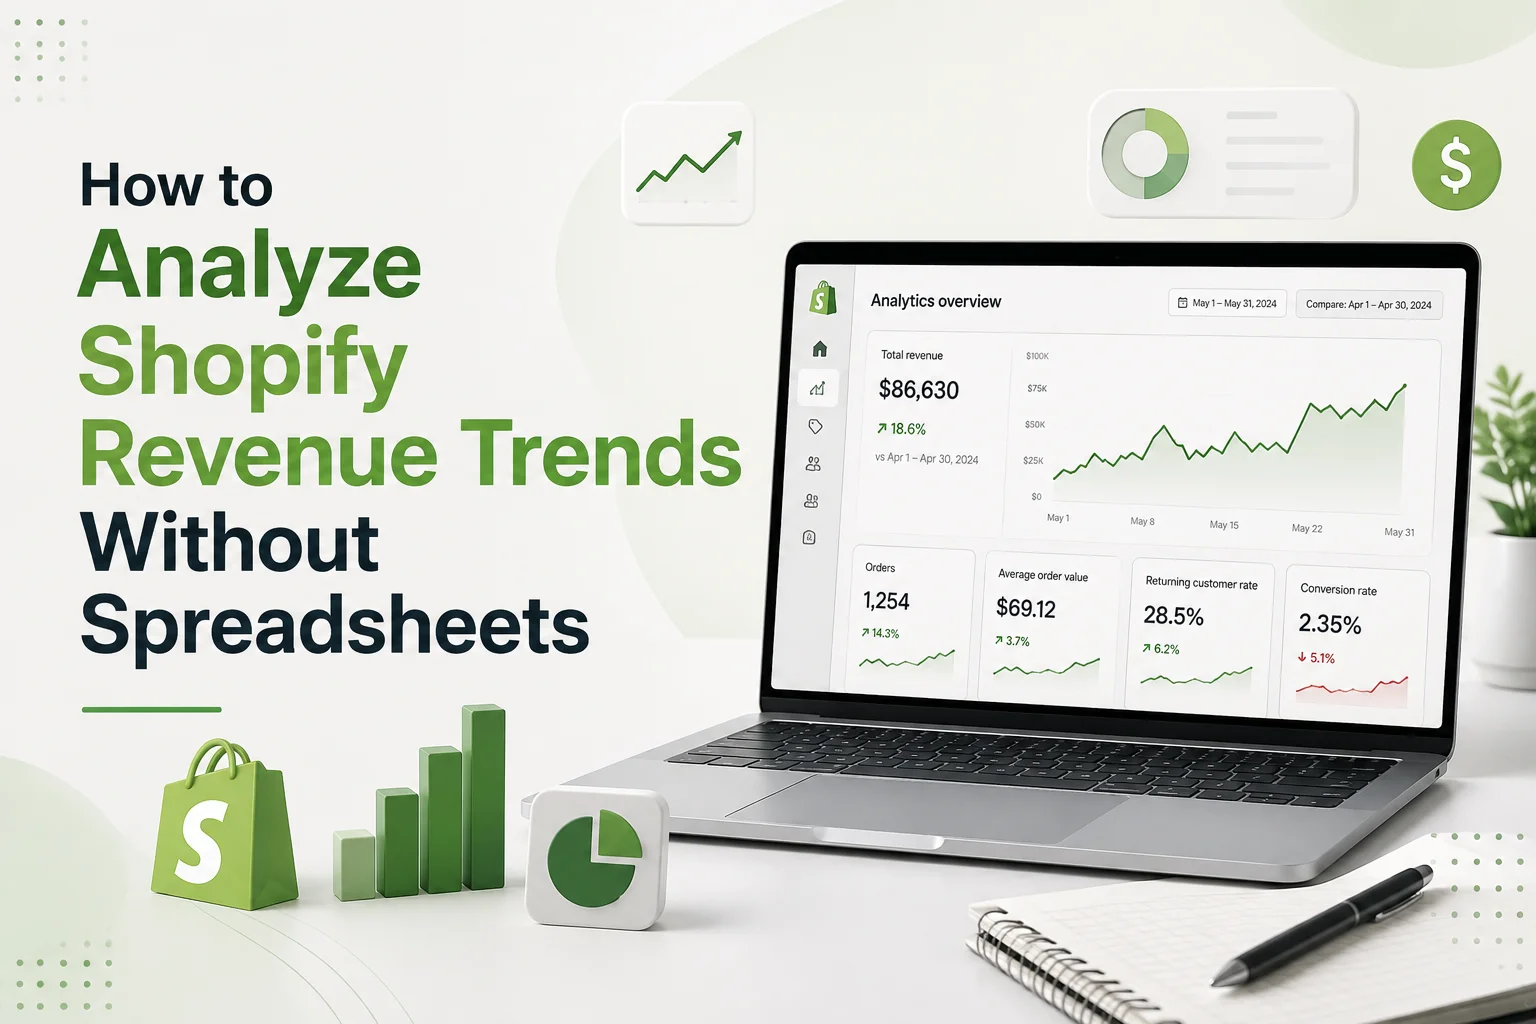
Many Shopify merchants still follow the same reporting routine: export sales data, open a spreadsheet, create formulas, build a chart and then repeat the process next week. Spreadsheets are useful when you need complex modelling or a completely custom analysis. But you do not need one every time you want to answer a basic question such as: Is revenue actually growing? What changed this month? Was the increase temporary? Which part of the store contributed to it?
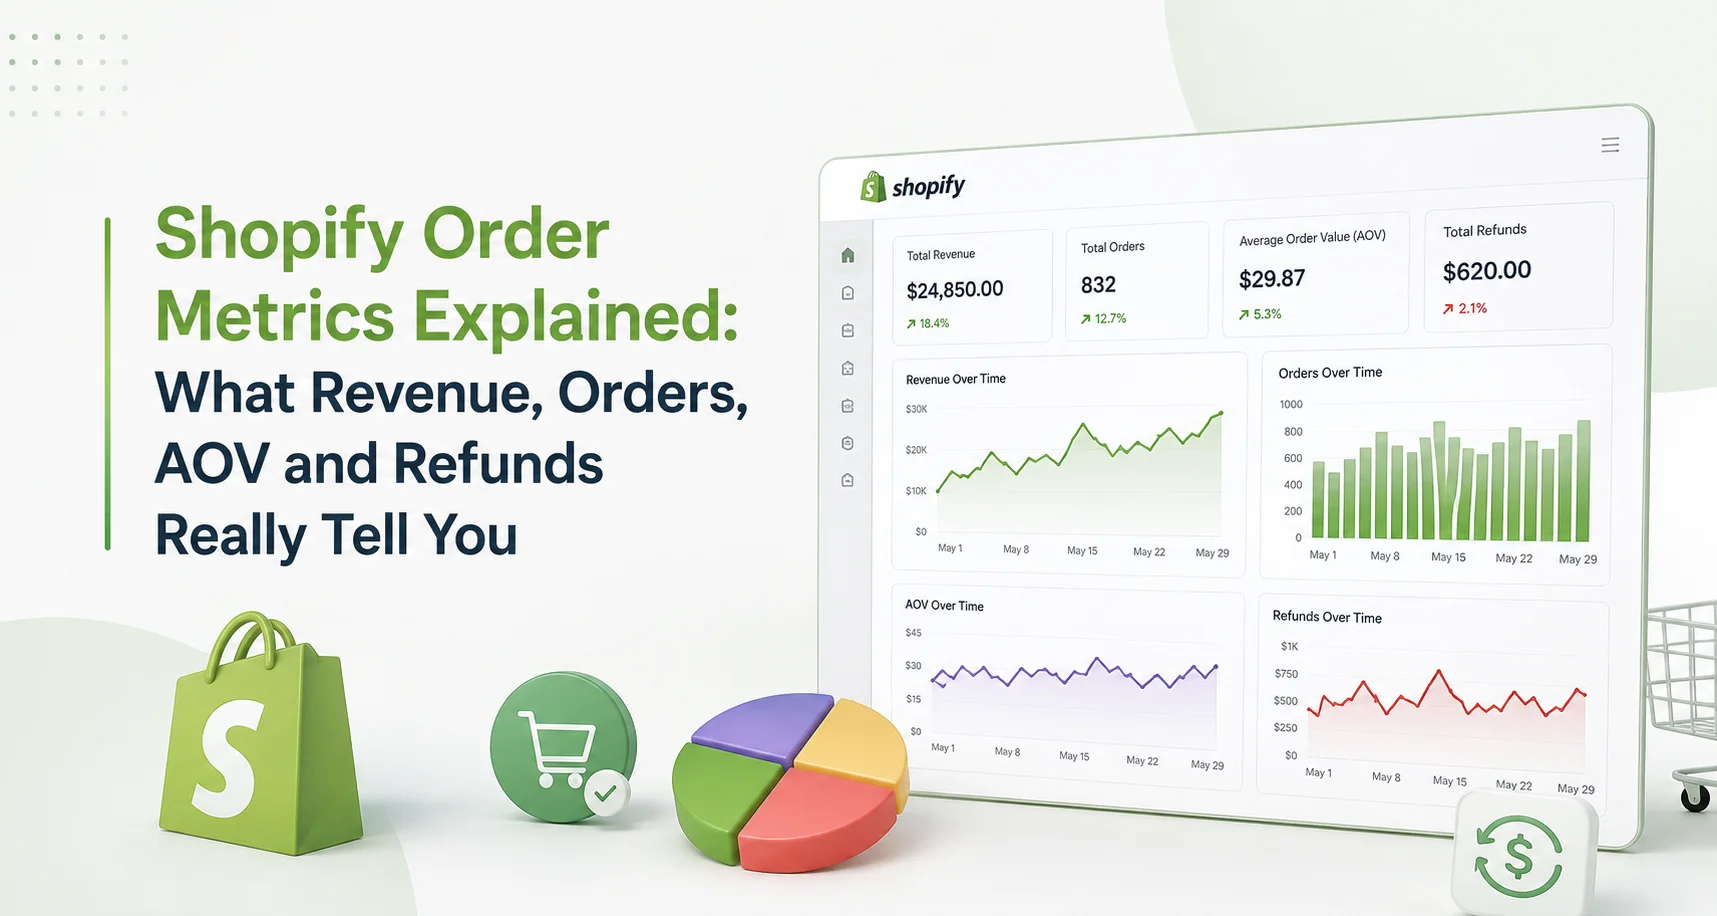
A store can have more orders and still generate disappointing revenue. Revenue can increase while customers spend less per purchase. Sales can look strong until refunds begin reducing the value of completed orders. That is why looking at one Shopify metric at a time can be misleading.
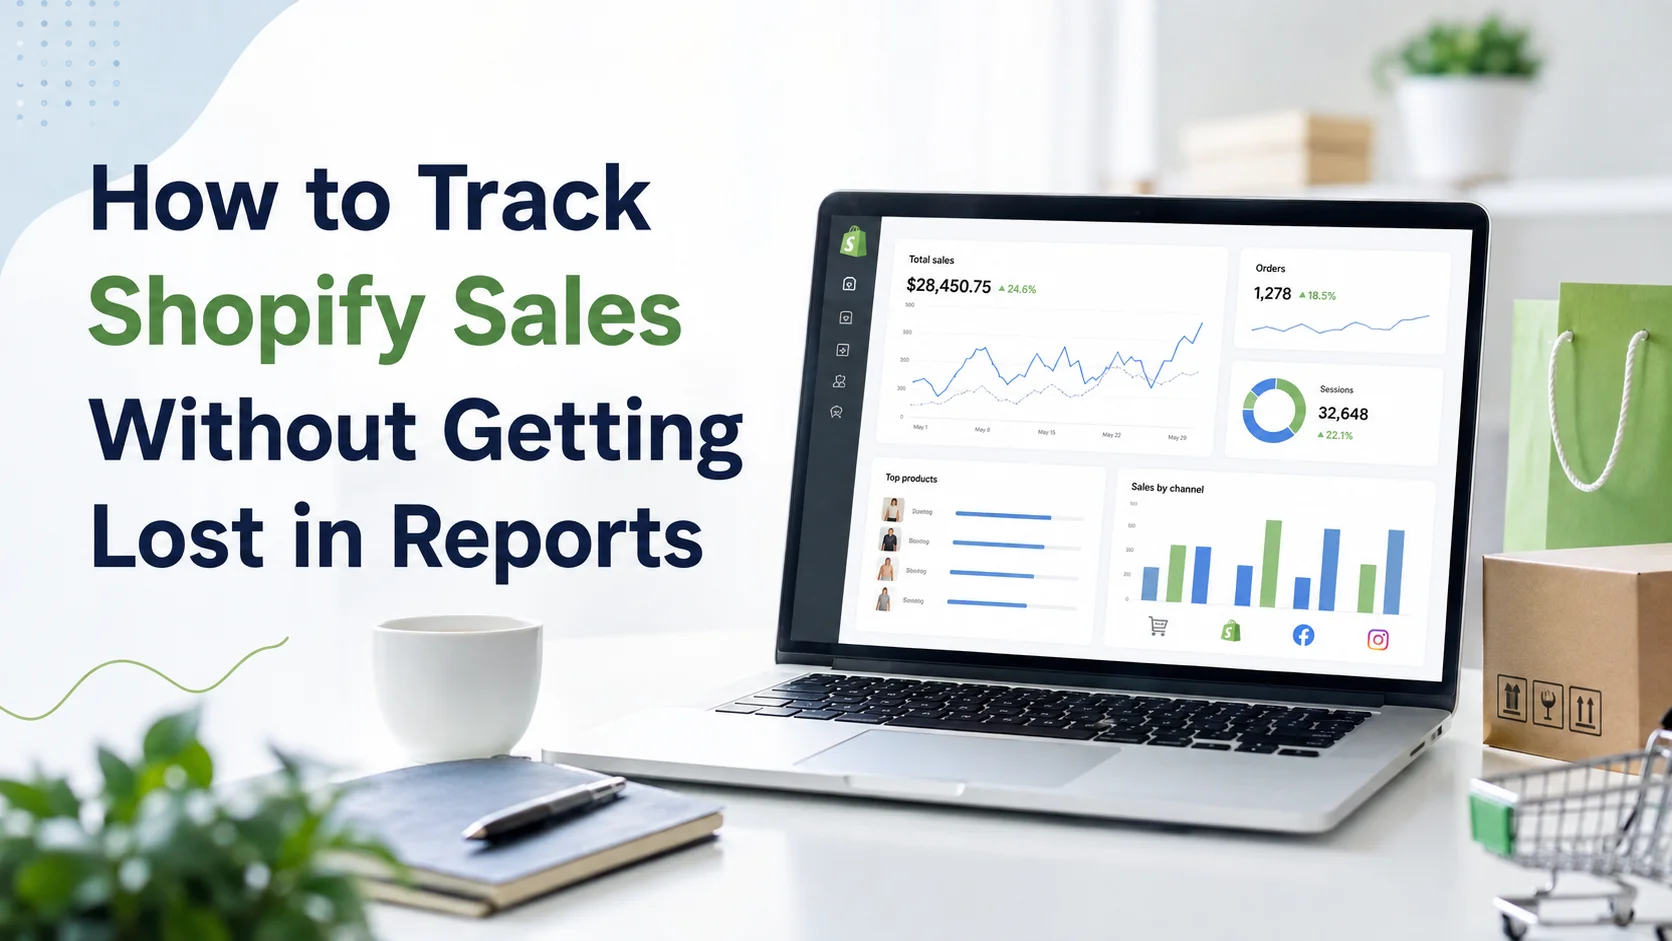
Tracking Shopify sales sounds simple until you open your store and realize there are several different numbers you could follow. There is gross sales, net sales, total sales, order count, average order value, sales by product, sales by channel and more. If you also use Google Analytics, advertising platforms or reporting apps, those tools can show slightly different numbers again.
Seeing that your Shopify sales increased is useful. Knowing why they increased is much more valuable. Revenue can grow because you received more orders, customers spent more per purchase, a high-value product performed unusually well or returning customers bought more frequently. The same applies when sales fall: the headline number shows the result, but it does not explain the cause.
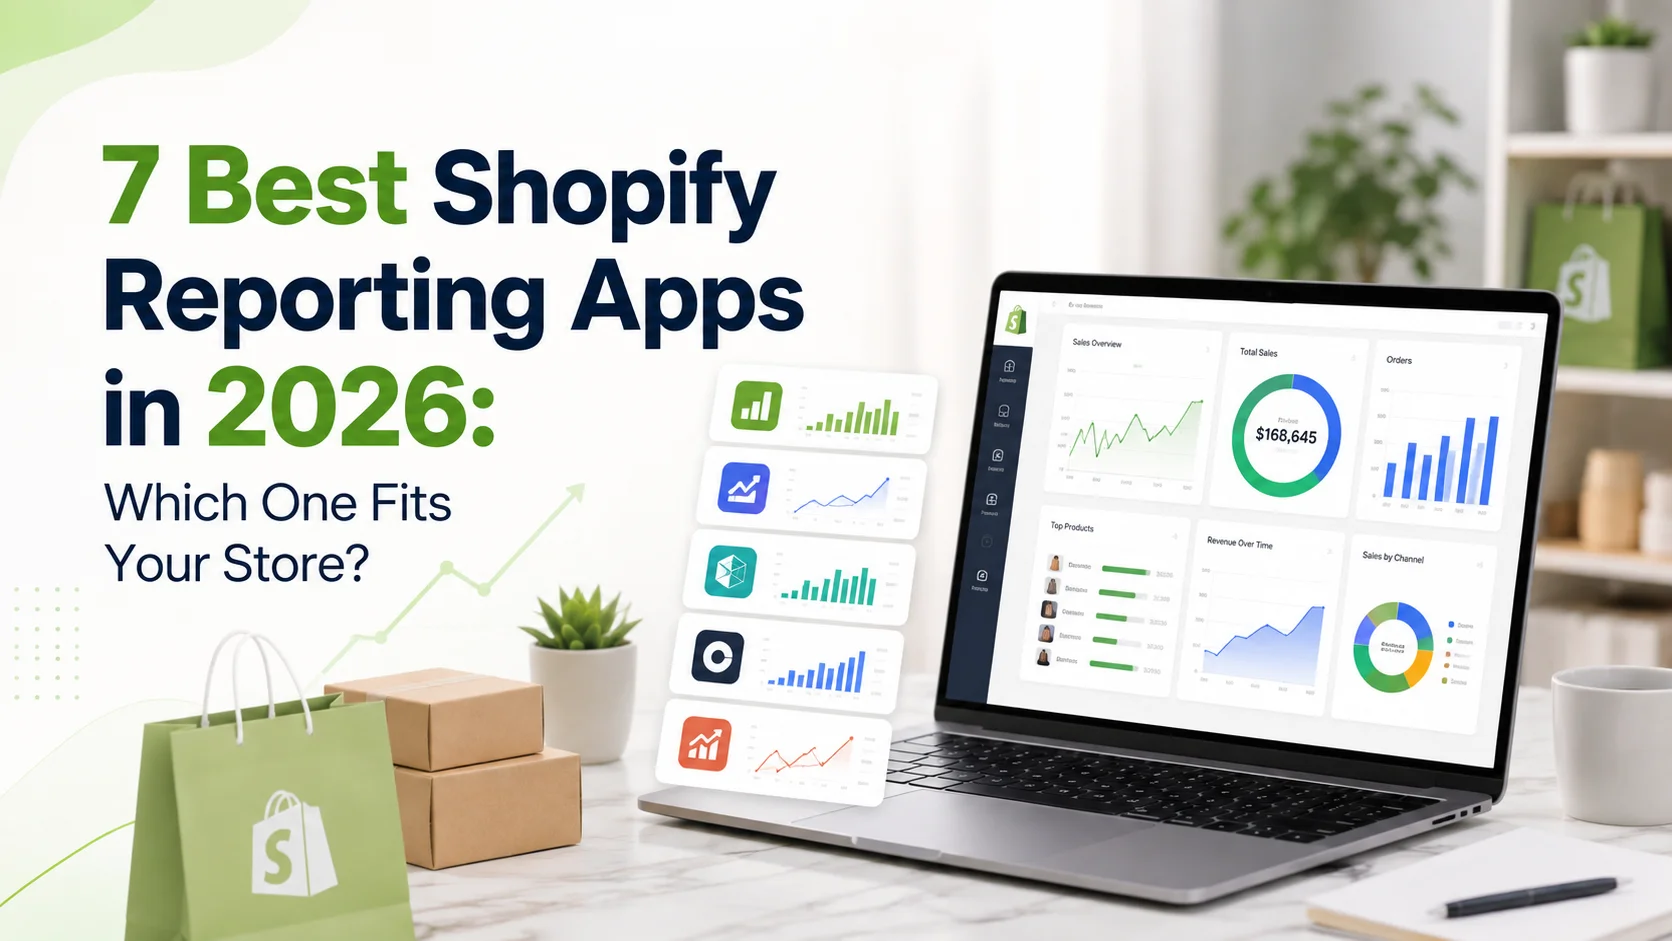
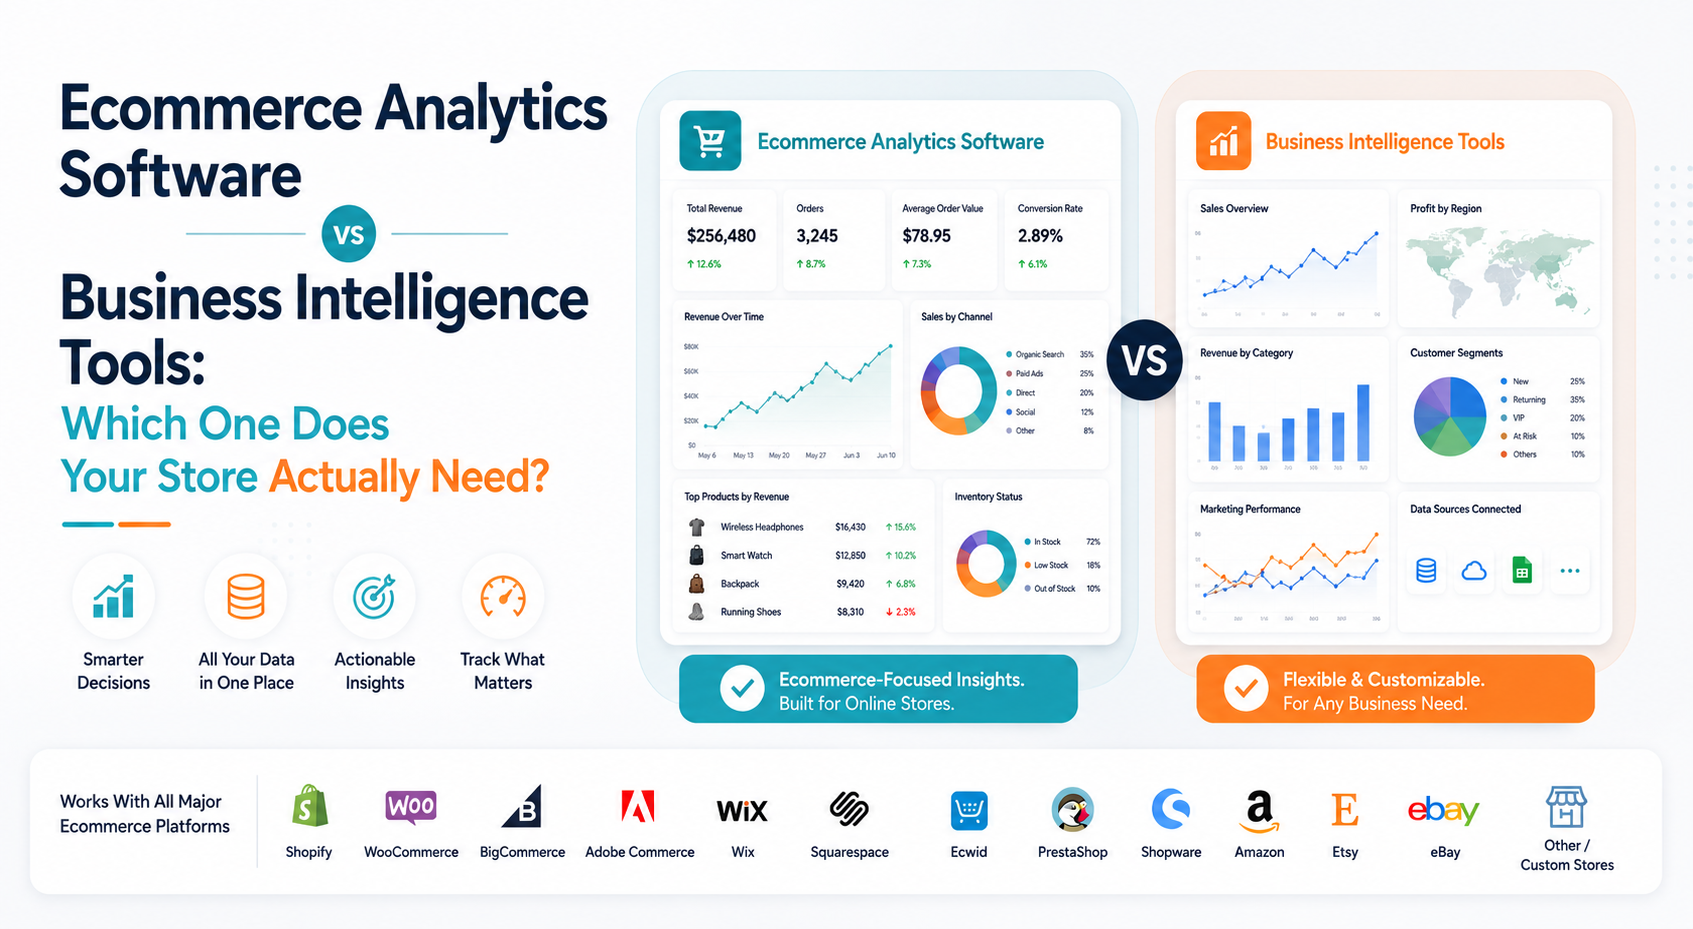
Shopify already gives merchants dashboards and reports for understanding sales, customers, products and store activity. Its current reporting system also supports customizable reports, ShopifyQL explorations and Sidekick-assisted query creation. The reporting available to a merchant can still depend on the Shopify plan and store setup. So why install another reporting app? Usually because you have a specific gap. Maybe you need scheduled spreadsheets for your accountant, more flexible custom reports, consolidated data from several stores, deeper lifetime-value reporting or AI explanations that make store performance easier to understand. That is the right way to compare Shopify reporting apps: start with the reporting problem, then choose the tool designed to solve it.
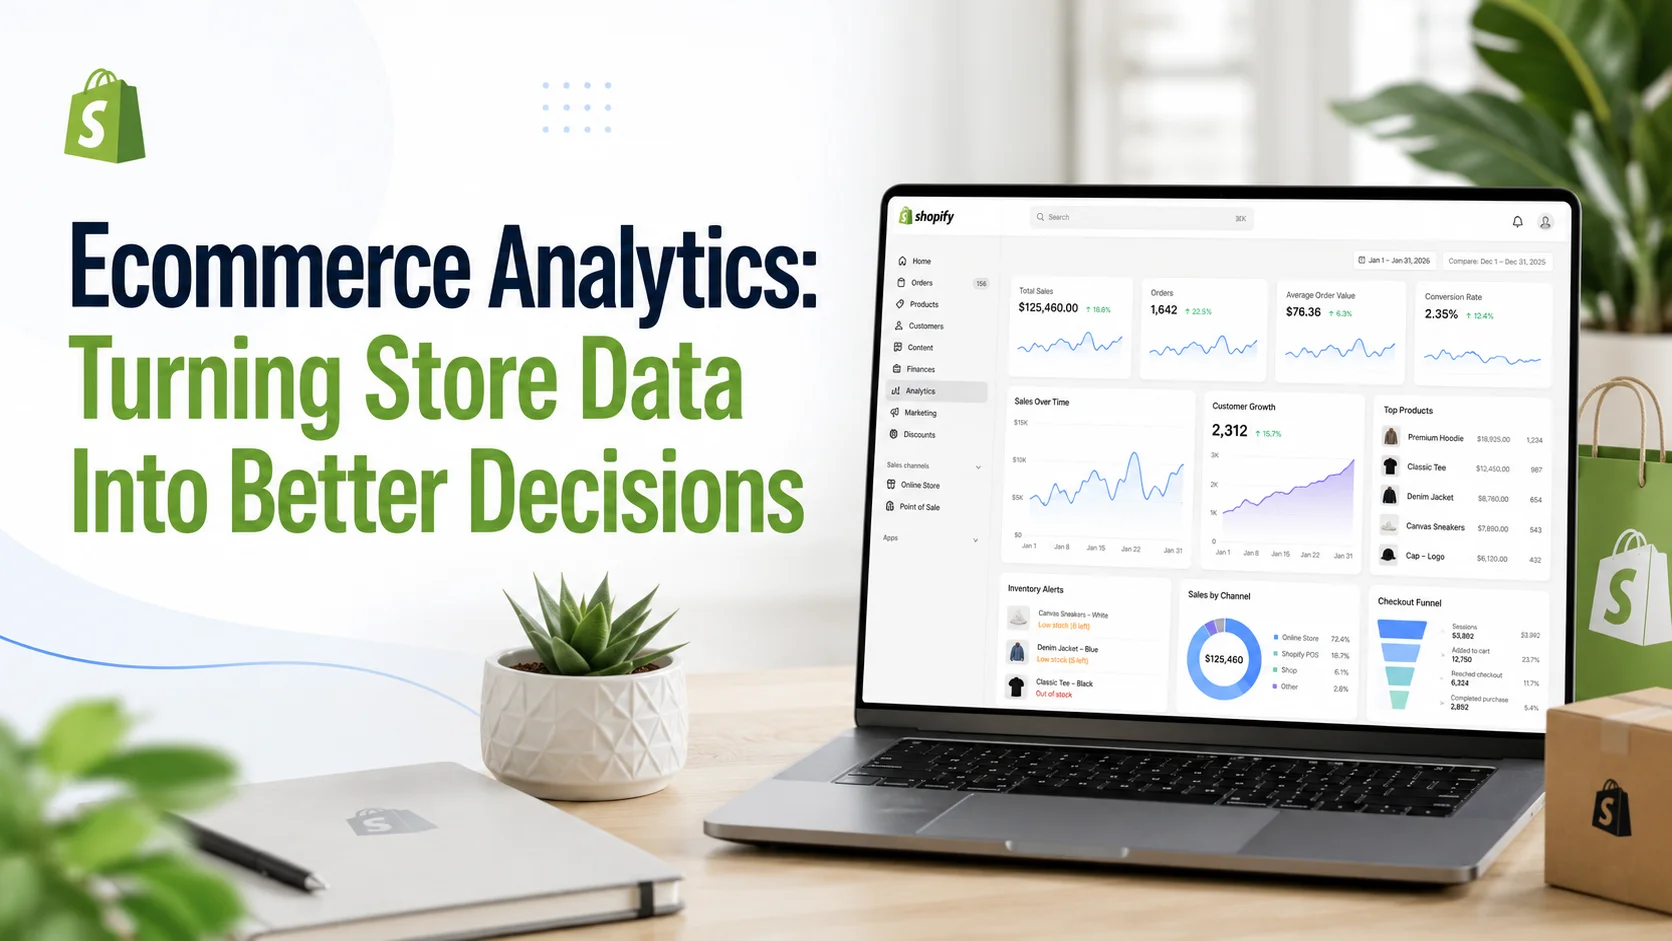
Your store can generate thousands of data points and still leave you unsure about what to do next. Revenue moved. Customers behaved differently. One product sold faster than expected. Another suddenly slowed down. Checkout abandonment increased. Refunds changed. Inventory tightened. These are signals, but signals are not decisions. The real value of ecommerce analytics comes from turning those signals into a clear business question, finding enough evidence to understand what is happening, deciding what action is worth taking and then checking whether that action actually worked. That is the difference between simply having data and using it well.
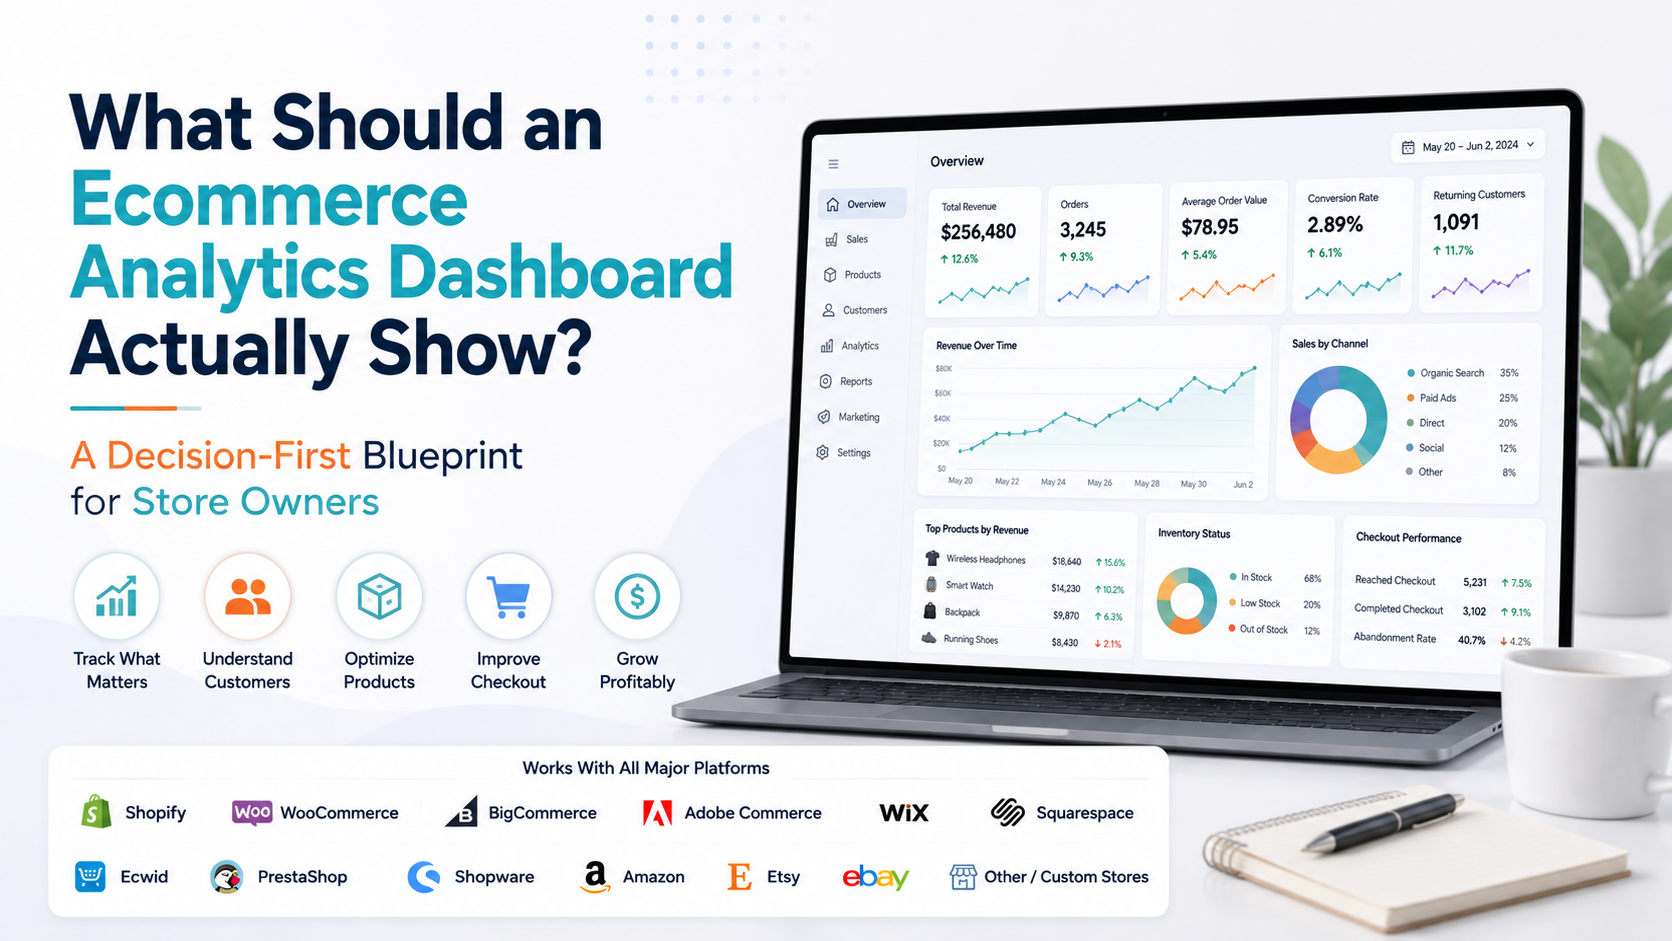
A Shopify dashboard can contain dozens of numbers. That does not mean you should watch all of them every day. The most useful dashboard is the one that helps you answer a small set of important questions: Are sales moving in the right direction? Are customers coming back? Which products are driving results? Is inventory restricting demand? And where is revenue being lost after a customer shows buying intent?
The Shopify App Store gives merchants many ways to track sales, build reports and analyze store performance. The difficult part is deciding which application will actually help your business. An app may offer hundreds of reports but still make it difficult to understand why revenue changed. Another may provide an attractive dashboard but leave out customer retention, inventory risks or checkout performance.
Opening a Shopify report is easy. Understanding what the numbers are telling you is harder. A merchant may see that sales increased this month and assume the store is growing. But the increase could come from one short promotion, a small group of repeat customers or a temporary spike in one product. Without looking deeper, the headline number can create the wrong impression.
Ecommerce data analytics helps online stores turn sales, customer, product, inventory and checkout information into practical decisions. This guide explains what to track, how to interpret the data and how to avoid common reporting mistakes. Every order, customer visit, product sale, abandoned checkout and refund creates useful information about an online store. The challenge is not collecting this data. The challenge is understanding what it means and using it to make better decisions.