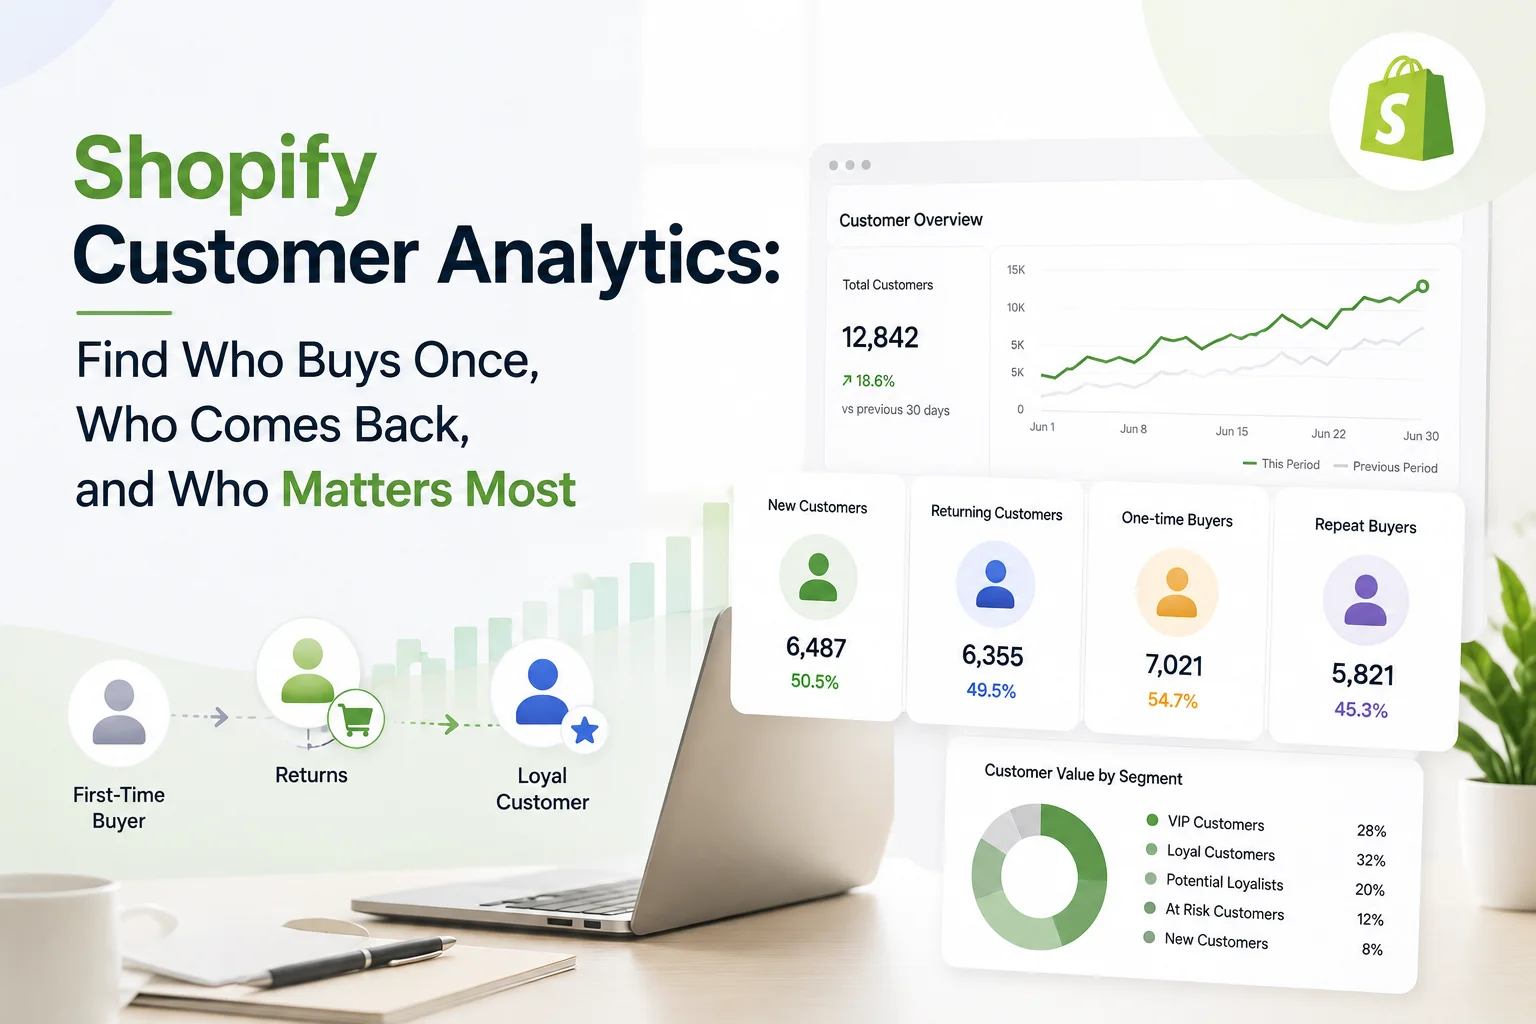
This is why Shopify customer analytics should go beyond counting customers. It should help you understand the quality of those relationships: who is buying for the first time, who returns, how long customers remain active, which groups spend more and which previously valuable customers may be drifting away.
Shopify currently provides customer reports covering areas such as new customers, new versus returning customers, one-time and returning buyers, customer cohorts, predicted spend tiers and RFM customer analysis. The useful part is not having all of these reports. It is knowing what question each one can answer.
Customer Count Does Not Tell You Whether the Customer Base Is Healthy
Imagine Store A gained 1,000 customers this quarter. Store B gained 700. At first, Store A looks stronger. But six months later, a large share of Store B's customers have made second and third purchases while most of Store A's buyers never returned.
Which store acquired the better customers? That is the type of question customer analytics is designed to answer. Customer growth should therefore be viewed through several lenses: acquisition, repeat behavior, spending, recency and retention. Instead of asking only:
How many customers did we gain? Ask: What happened after their first purchase? That question changes the way you evaluate customer growth.
Start by Separating First-Time and Returning Customers
One of the simplest useful customer analyses is separating people placing their first order from customers who have purchased before. Shopify's New vs returning customers report does exactly this. Shopify defines a first-time customer as someone placing their first order with the store, while a returning customer has an existing order history before the order being analyzed.
This distinction helps you understand the source of customer activity. Suppose total customer orders increase by 20%. If almost all of that growth comes from first-time customers, acquisition is doing most of the work. If returning-customer activity also rises, the business may be improving both acquisition and retention.
Neither situation is automatically better. The interpretation depends on your business model. A store selling furniture may naturally have a longer repeat-purchase cycle than a store selling coffee, skincare or supplements. Customer analytics should reflect how often customers realistically need the product.
A Returning Customer Is Not Automatically a Loyal Customer
This is an important distinction. Someone who purchases twice over three years technically returned. That does not necessarily make them highly loyal. Likewise, two customers with the same order count may have very different relationships with your store.
Customer A placed four orders during the last six months.
Customer B placed four orders but has not purchased anything for two years.
Their historical frequency is similar, but their recency is completely different. This is why customer analysis becomes more useful when order count, spending and time since the last order are evaluated together rather than separately.
Cohort Analysis Shows What Happens After Acquisition
One of the most valuable questions in ecommerce is: Do customers acquired during different periods behave differently afterward? That is what cohort analysis helps answer. Shopify's Customer cohort analysis groups customers according to when they placed their first order and then tracks how those groups behave over later weeks, months or quarters. Merchants can analyze metrics including customer retention, gross sales, net sales, average order value and amount spent per customer.
Suppose you acquired customers during January, February and March. Instead of combining all three groups, cohort analysis lets you compare them separately. Perhaps January customers continue purchasing several months later while March customers disappear quickly. That raises a useful business question:
What was different about the customers acquired in January?
Maybe they came from a different marketing channel. Perhaps they purchased a different first product. Maybe a January promotion attracted people who were a better fit for the brand. Shopify's cohort details can include information such as total sales, average order value, amount spent per customer, new and returning customers, marketing channels, sales channels, subscription behavior and customer locations. That gives you much more to investigate than a general retention percentage.
Do Not Judge Acquisition Only by the First Order
A marketing campaign can look successful when evaluated immediately after purchase. Imagine Campaign A acquires customers at a lower cost than Campaign B. If you stop there, Campaign A looks better. But what if customers from Campaign B continue purchasing for six months while most Campaign A customers buy once? The acquisition decision now looks different. Customer analytics helps merchants evaluate customer quality after acquisition, not simply the number of first orders generated.
For stores with enough history, Shopify's cohort analysis can also show projected amount spent per customer. Shopify states that these projections use the store's own previous 24 months of cohort data, and it explicitly warns that projections are estimates rather than guarantees. That caution matters. Predictive information should help prioritize investigation. It should not be treated as guaranteed future revenue.
RFM Analysis Gives Customer Behavior More Context
Once a store has enough customer history, simply separating new and returning customers may be too broad. This is where RFM analysis becomes useful. RFM stands for:
Recency: How recently the customer purchased.
Frequency: How many orders the customer has placed.
Monetary value: How much the customer has spent.
Shopify's RFM customer analysis assigns scores from 1 to 5 across these dimensions and then categorizes customers into 11 predefined groups. Shopify notes that the scoring is based on the store's own customer data rather than external industry benchmarks.
This is useful because customer behavior becomes relative to your business. A highly valuable customer for a small niche store may look very different from a highly valuable customer for a large fashion retailer.
Shopify's RFM groups currently include categories such as Champions, Loyal, Active, New, Promising, Needs Attention, At Risk, Previously Loyal, Almost Lost, Dormant and Prospects. The purpose of these labels is not to decorate a dashboard. They can help you decide which relationship deserves which response.
“At Risk” Is More Useful Than “Inactive”
Calling every customer who has not purchased recently “inactive” can be misleading. A customer who bought once eighteen months ago is very different from someone who ordered frequently for two years and suddenly stopped.
The second customer represents a stronger potential loss. RFM-style analysis helps distinguish those situations because it considers previous order frequency and spending as well as recency. Suppose you have two customers who have not purchased for 120 days.
One previously placed one low-value order. The other placed twelve orders and was historically one of your stronger customers. They should not automatically receive the same retention strategy. The second customer may deserve more attention precisely because there is evidence of an established relationship that has weakened.
Customer Value Is More Than Total Spend
Total customer spend is useful, but it can hide important differences. Customer A spent $1,000 through one unusually large purchase. Customer B also spent $1,000, but through ten repeat orders across a year. Financially, their historical spend is equal. Behaviorally, they are very different customers.
Customer B has demonstrated repeated engagement with the store. Customer A has demonstrated high spending but not repeat behavior. A useful customer analysis therefore considers multiple dimensions together:
Total amount spent
Number of orders
Time since the last purchase
Average order value
Repeat-purchase behavior
Products purchased
Acquisition cohort or channel
The goal is not to create one perfect “customer value” number. It is to understand the nature of the relationship.
Predicted Spend Tier Can Help Prioritize Customers, but Use It Carefully
Shopify also provides a predicted spend tier, which categorizes eligible customers as High, Medium or Low based on their future spending potential. Shopify says the prediction considers factors including purchase frequency, average order spend relative to the store average, total order count and how recently the customer purchased.
The feature requires the store to have more than 100 sales, and only customers who have made purchases are included. This can be useful for prioritization. For example, a store could create a segment containing customers in the High predicted-spend tier who are subscribed to email marketing.
But the word predicted matters. A High tier does not guarantee that a customer will purchase again, just as a Low tier does not mean the customer has no future value. Treat predictive tiers as one signal among several rather than a final verdict on the customer.
Segmentation Is Where Analytics Becomes Actionable
Customer analytics becomes particularly useful when you can turn an observation into a group of people you can actually work with. Shopify's customer segmentation supports filters including amount spent, location, first and last order dates, number of orders, products purchased, predicted spend tier, RFM group, marketing subscription status and other customer attributes.
That opens the door to much more relevant customer strategies. Instead of emailing “all customers,” you could identify customers who: Purchased a particular product but have not reordered within the normal purchase cycle. Previously purchased frequently but have moved into an at-risk group. Belong to a historically strong acquisition cohort.
Have high predicted spending potential and are subscribed to marketing. Purchased once recently and need a strong post-purchase experience before you worry about another promotion. The analytical question should always come before the segment. Do not create segments merely because the software allows it. Create them because you know what business question the group helps you answer.
Connect Customer Behavior With What They Bought
Customer analytics becomes much more powerful when customer groups are connected with products. Suppose your strongest repeat customers disproportionately began their relationship with one particular product. That product may be doing more than generating first-order revenue. It may be an effective entry point into a longer customer relationship.
Now imagine another product generates many first-time purchases but very few of those customers return. That does not necessarily make the product bad. But it tells you something important about the type of customer journey it creates. Ask questions such as:
Which first products are associated with stronger repeat purchasing?
Which products are most common among loyal customers?
Are customers who buy Product A more likely to return than customers who begin with Product B?
Which products are commonly purchased by customers who later become high-value?
These questions move customer analytics beyond marketing and into merchandising. For a broader explanation of how customer, sales, product and inventory information connect, read our ecommerce data analytics guide.
Customer Analytics Can Also Improve Marketing Evaluation
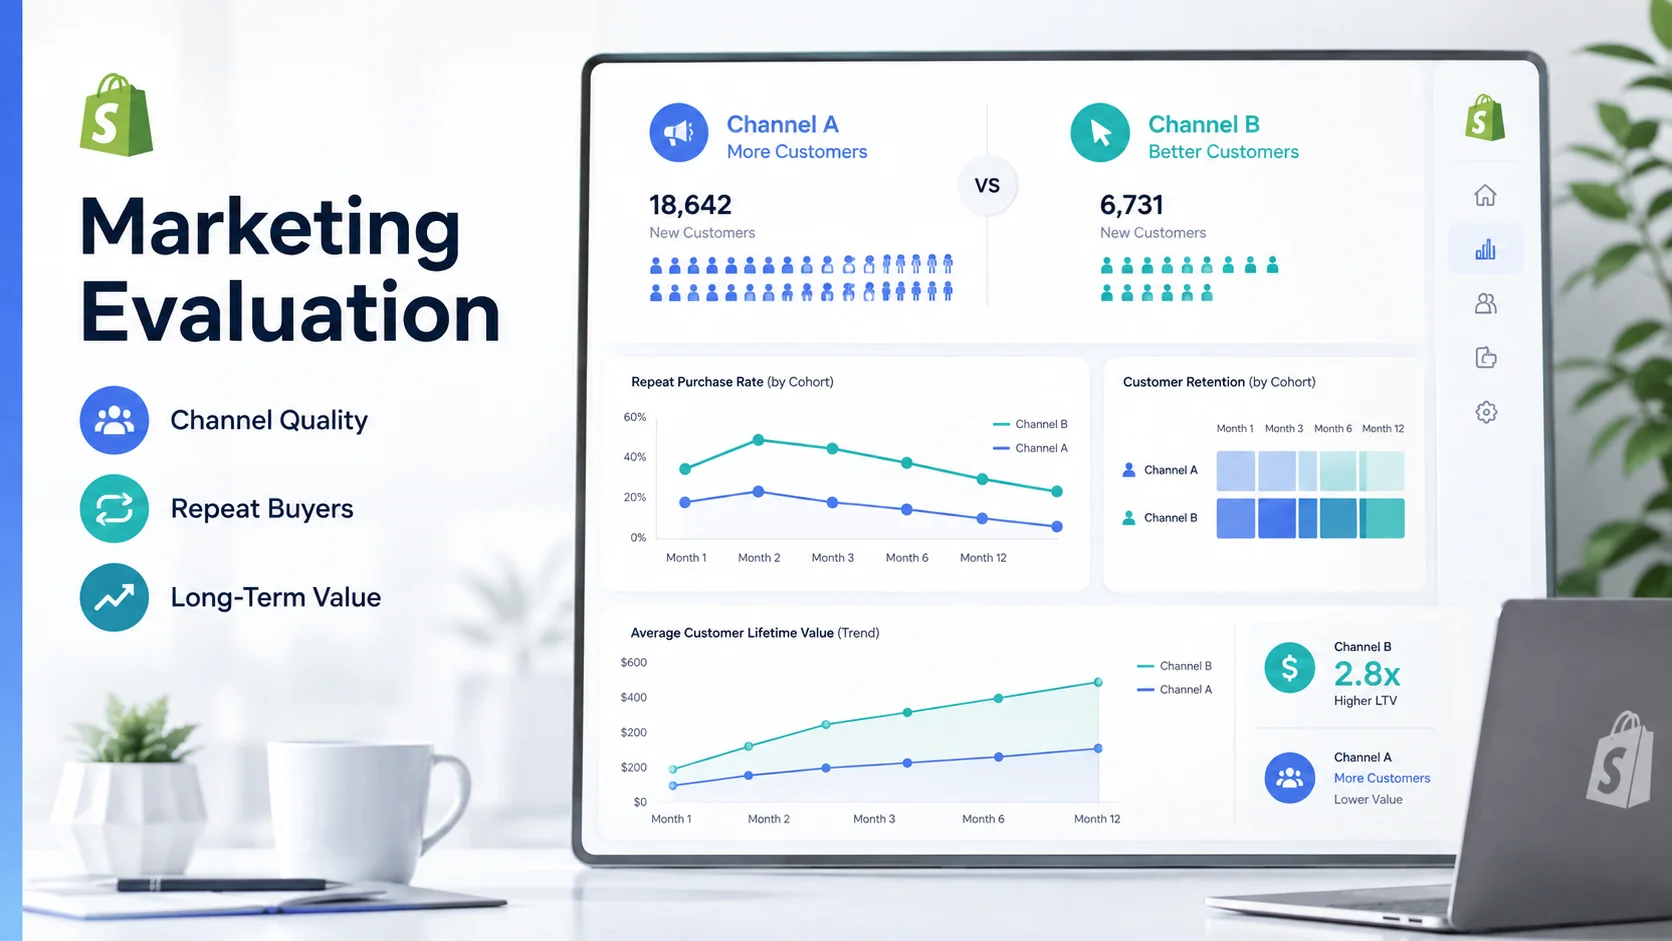
Marketing reports often focus heavily on acquisition. Clicks, sessions, conversions and first purchases are relatively easy to measure. The harder question is whether the customers acquired through one source become more valuable than customers from another source.
Shopify's cohort analysis can include information about marketing channels associated with customers in a cohort, which creates an opportunity to evaluate acquisition quality over time rather than only first-order performance.
Imagine Channel A acquires 500 customers and Channel B acquires 300. Channel A appears stronger by volume. But after six months, Channel B's customers may have higher repeat-order activity and greater amount spent per customer. Now you have a much better marketing question: Which channel is bringing the type of customer we actually want more of? That is more useful than simply asking which channel produced the cheapest first order.
Build a Customer Review Around Movement Between Groups
A useful monthly customer review should not simply report that you have 10,000 customers. Instead, look for movement.
Did the number of returning customers increase?
Are strong customers becoming less recent?
Which acquisition cohorts maintain better retention?
Is one customer segment contributing more revenue than before?
Are previously loyal customers moving into at-risk or dormant groups?
Are new customers progressing toward repeat purchase?
This creates a much more useful picture of customer health. The question becomes: How is the relationship with our customer base changing? That is fundamentally different from simply counting how many people exist in the database.
A Practical Example: Revenue Is Growing, but Customer Quality Is Weakening
Imagine monthly revenue increases by 12%. At first, the business appears healthy. Customer analysis shows that new-customer orders increased strongly after a promotional campaign. But returning-customer revenue declined.
Cohort analysis also shows that customers acquired during recent campaigns are making fewer repeat purchases than earlier cohorts. The business is still growing today, but the quality of that growth deserves attention. Instead of immediately increasing acquisition spend again, the merchant might investigate:
What products those new customers purchased.
Whether expectations matched the actual product experience.
Whether post-purchase communication changed.
Whether the promotion attracted unusually price-sensitive buyers.
Whether earlier high-retention cohorts came from different channels or first products.
Customer analytics has not given one guaranteed cause.
It has shown where the next investigation should happen. That is exactly what good analytics should do.
Do Not Turn Customer Analytics Into Constant Discounting
Finding a valuable or at-risk customer does not mean the answer should always be a coupon. An at-risk customer may have stopped buying because they no longer need the product, because a favorite item is unavailable, because the experience changed or because they simply have a long natural purchase cycle.
Likewise, loyal customers may value early product access, better service, useful recommendations or recognition more than another discount. Customer analytics tells you who deserves attention. Your business context determines what kind of attention makes sense. This distinction matters because aggressive discounting can change customer behavior rather than simply reward it.
Know the Limits of Customer Predictions
Customer models can be extremely useful, but they are built from historical behavior. That creates limitations.
A previously loyal customer may leave because their personal needs changed.
A low-spending customer may suddenly become valuable.
A predicted high-value customer may never purchase again.
A cohort with strong past retention may behave differently under new economic or competitive conditions.
Shopify explicitly cautions that its cohort spending projections are estimates and can differ from actual future results. Use customer analytics to improve your probabilities, not to pretend uncertainty has disappeared.
When a Dedicated Customer Analytics View Helps
Shopify already provides substantial customer reporting and segmentation capabilities, including cohort analysis, predicted spend tiers and RFM groups. A separate analytics application becomes useful when you want customer information connected more directly with the rest of store performance. For example, you may want to understand whether a change in returning-customer activity occurred alongside product availability, revenue movement or checkout behavior.
Statty AI's Shopify analytics dashboard combines customer intelligence with sales, products, inventory, checkout activity, store health and other store information. Merchants who want these relationships in a connected view can explore the AI-powered Shopify analytics app rather than reviewing customer behavior as an isolated report.
The Customer Questions Worth Asking
The strongest customer analytics strategy is not built around the largest number of reports. It is built around better questions.
Do not stop at: How many customers do we have? Ask: How many came back?
Do not stop at: Who spent the most? Ask: Who spends consistently and is still active?
Do not stop at: Which campaign acquired more customers? Ask: Which campaign acquired customers who remained valuable?
Do not stop at: Which customers are inactive? Ask: Which previously valuable relationships are weakening?
Do not stop at: Is customer revenue growing? Ask: Which customer groups are creating that growth?
That is the real purpose of Shopify customer analytics. It turns the customer database from a list of names and orders into a clearer picture of acquisition quality, retention, customer value and changing relationships. And once you understand those relationships, your marketing, merchandising and retention decisions become much more specific.