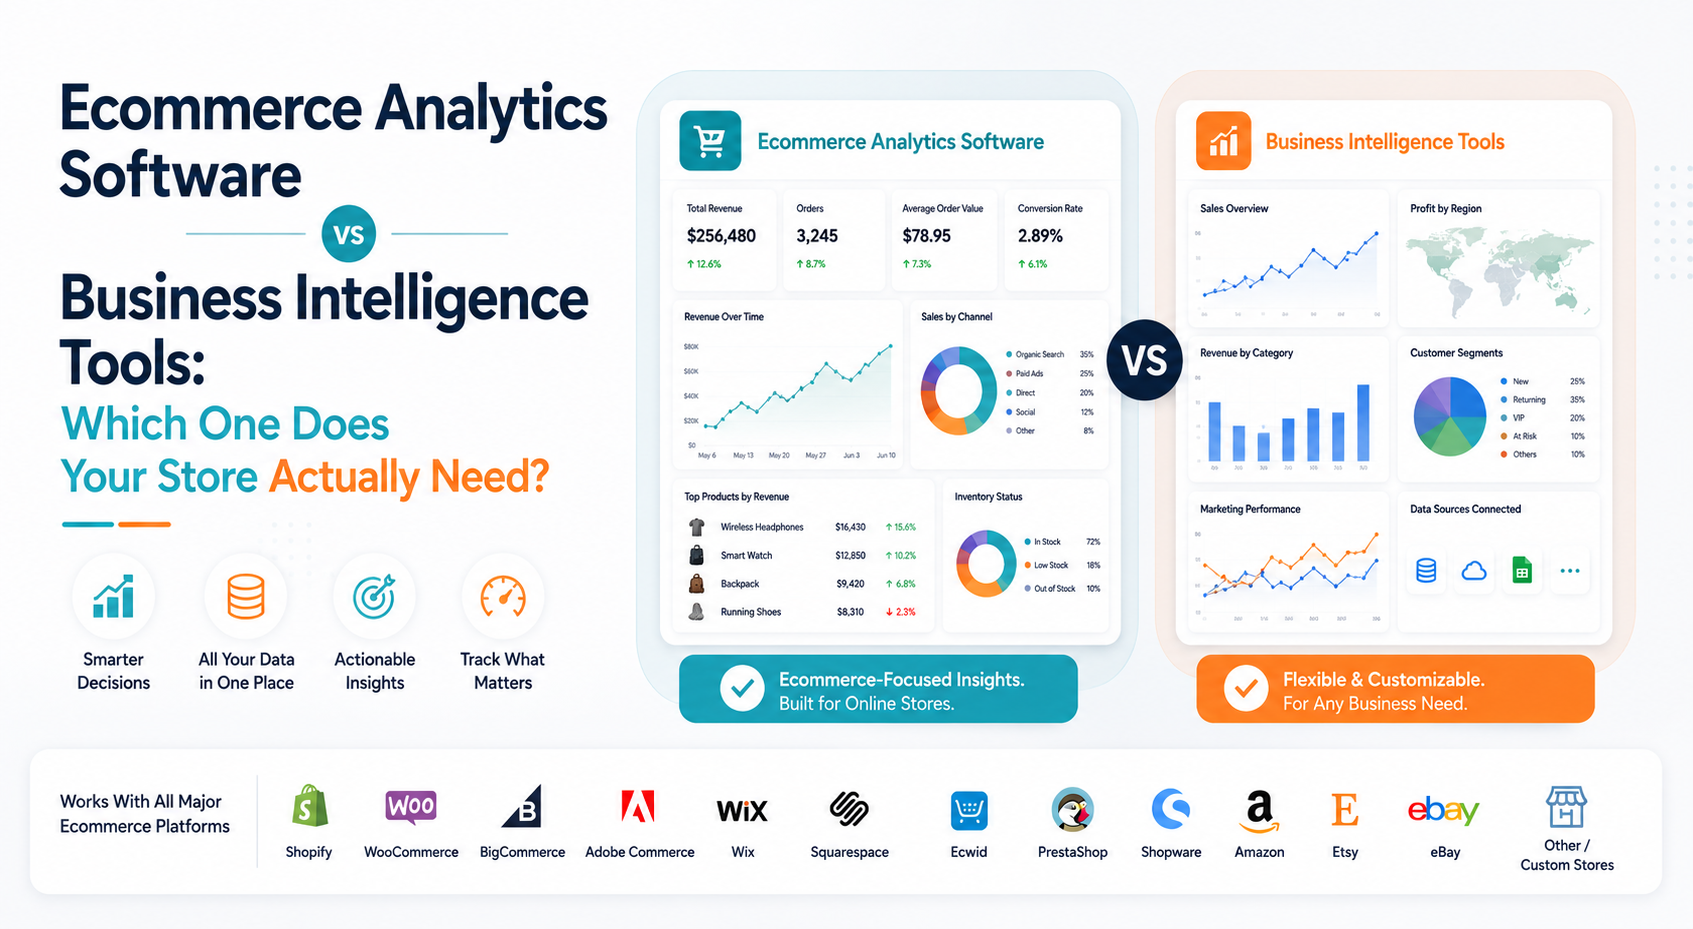
An ecommerce business can reach a point where basic platform reporting is no longer enough. Sales data sits in the storefront. Advertising performance is somewhere else. Inventory may be managed through another system.
Customer information, returns, marketplace activity and financial data may each have their own reports. At that stage, businesses usually look in one of two directions. The first is ecommerce analytics software, built specifically around online store questions.
The second is a business intelligence tool, such as Power BI, Tableau or Looker, designed to analyze data across many parts of an organization. Both can create dashboards. Both can connect data. Both can support better decisions. But they solve the problem from different starting points.
The important question is not which category is more powerful. It is which level of flexibility, setup and technical control your business actually needs.
What Is Ecommerce Analytics Software?
Ecommerce analytics software is designed around the structure and decisions of an online commerce business. Instead of starting with an empty analytical environment, it usually begins with familiar commerce concepts such as sales, orders, customers, products, inventory, conversion, checkout activity, refunds and returns.
Shopify's current enterprise analytics guidance describes ecommerce analytics as connecting information from storefront interactions, checkout activity, customer profiles, product catalogs, marketing campaigns, returns, inventory systems and other commerce sources to support decisions.
Purpose-built ecommerce analytics software takes that commerce context and tries to make it usable quickly. The merchant should not have to design a complete data model simply to answer:
- Which products generated the most revenue?
- Are returning customers becoming less active?
- Which important products are approaching a stock problem?
- Why did revenue change compared with last month?
That prebuilt business context is one of the biggest differences between ecommerce analytics software and general BI.
What Is a Business Intelligence Tool?
Business intelligence is broader. Microsoft defines BI as using current and historical data to uncover insights for strategic decisions. BI systems commonly collect and transform information from multiple sources, analyze it and present the results through reports and visualizations.
A BI tool does not assume your business is ecommerce. It might analyze retail data today, finance tomorrow, manufacturing next week and HR after that. That flexibility is the point. Platforms such as Power BI, Tableau and Looker can model relationships across databases, files, cloud applications and enterprise systems.
Tableau, for example, supports data models built from multiple related tables, while Looker uses a governed semantic model so organizations can centrally define business logic and metrics. That makes BI extremely flexible. It also means somebody usually has to define what the business wants the data to mean.
The Simplest Difference
The distinction can be summarized like this:
- Ecommerce analytics software starts with ecommerce questions.
- Business intelligence tools start with data.
An ecommerce analytics product may already understand that orders belong to customers, customers make repeat purchases, products have inventory and sales can be affected by refunds.
A BI tool can understand all of those relationships too, but someone may need to build the data model first. Neither approach is automatically better. They are optimized for different levels of complexity.
Ecommerce Analytics Software vs BI Tools at a Glance
| Area | Ecommerce Analytics Software | Business Intelligence Tools |
|---|---|---|
| Main purpose | Analyze ecommerce performance | Analyze data across the organization |
| Starting point | Prebuilt commerce metrics and workflows | Flexible data sources and custom models |
| Setup | Usually faster | Can require more implementation |
| Commerce knowledge | Often built in | Usually defined by your team |
| Custom analysis | Moderate to advanced, depending on product | Very high |
| Data modeling | Mostly handled by the platform | Often designed or managed by the business |
| Technical skills | Usually lower | Can require analysts, SQL, modeling or engineering |
| Enterprise data | May be limited to supported commerce sources | Can combine commerce, finance, CRM, ERP and many other sources |
| Governance | Usually product-defined | Can be highly customized |
| Best fit | Merchants and ecommerce teams | Data teams and complex organizations |
The table is useful as a starting point, but your decision should depend on how your reporting actually works today.
Ecommerce Analytics Usually Gets You to the First Answer Faster
Imagine your store owner wants to know: Which high-selling products are becoming risky because inventory is running low? In purpose-built ecommerce analytics software, product sales and inventory may already be connected.
You choose the relevant report or dashboard and begin investigating. In a BI environment, you may first need to connect order data and inventory data, determine how products match across both sources, define the correct inventory measure and create the calculation that identifies risk.
Once the BI model exists, the analysis can be extremely powerful. The difference is the work required before the first useful answer appears. This is why ecommerce analytics software often has a shorter time to value for businesses that mainly need commerce questions answered.
BI Gives You Much More Freedom to Define the Business
Now imagine the question becomes: Which products generated the highest contribution margin after product cost, shipping subsidies, advertising spend, payment fees and return costs, broken down by region and acquisition channel?
That is a different analytical problem. You may need:
- Order data.
- Cost-of-goods data.
- Advertising platforms.
- Shipping systems.
- Payment information.
- Refunds.
- Customer attribution.
- Regional data.
Perhaps even finance or ERP information. This is where BI becomes much more attractive. Microsoft describes BI as combining and transforming data from multiple sources before analyzing it as a broader dataset.
Tableau and Looker similarly support data relationships and governed analytical models across different sources. The more your questions move beyond ecommerce operations and into the entire business, the stronger the case for BI becomes.
The Real Difference Is the Data Model
A dashboard is only the visible part of analytics. The more important difference sits underneath it. Consider this question: What is revenue?
One business may define revenue as gross product sales. Another may use net sales after discounts and refunds. Finance may want a different definition again. A purpose-built ecommerce analytics application usually provides predetermined definitions based on the commerce data it receives.
A BI environment lets the organization create a reusable model containing its own definitions. Power BI uses semantic models to define business-friendly metrics, calculations and relationships so that multiple reports can rely on consistent logic.
Looker follows a similar approach through its governed semantic model and LookML. That governance becomes increasingly valuable as several departments start using the same data.
BI Becomes More Valuable When Several Teams Need the Same Numbers
A small ecommerce company may have one person reviewing store performance. A larger organization might have:
- Marketing.
- Finance.
- Operations.
- Merchandising.
- Customer service.
- Supply chain.
- Executive leadership.
Each team may need different reports but still rely on the same core information. Finance might want sales by accounting period. Operations may want units by fulfillment location. Marketing may want customer acquisition by channel.
Leadership may want a consolidated commercial view. A mature BI environment can define shared data once and allow different teams to build reports around it. BI platforms also provide access-control mechanisms for these environments.
Power BI supports semantic-model permissions and row-level security, while Tableau provides row-level security options that can restrict which records different users are allowed to view. A normal ecommerce analytics application may not need this level of governance because its user and reporting model is simpler.
Does BI Require a Data Warehouse?
Not always. Modern BI tools can connect directly to many data sources. Power BI, for example, supports files, cloud services, relational databases and analytics platforms.
It can import information, query compatible sources directly or use other connection modes depending on the architecture. A warehouse becomes more useful when data volume, historical requirements and modeling complexity increase.
Microsoft's current Power BI modeling guidance specifically recommends considering a data warehouse and ETL process when large data volumes or advanced transformation requirements make direct preparation inside the semantic model difficult.
- So the progression might look like: Store data → BI tool for a relatively simple case.
- A more complex business might use: Storefronts + marketplaces + CRM + ERP + advertising + finance → data warehouse → BI semantic model → dashboards
That architecture can be powerful. It is also significantly more work to build and maintain.
Ecommerce Analytics Software Usually Hides the Data Engineering
This is an important advantage for merchants without a data team. Someone still has to connect, normalize and process the information. The difference is that the analytics vendor handles most of that complexity behind the product.
The store owner sees customer analytics rather than customer-table relationships. They see inventory insights rather than database joins. They see revenue comparisons rather than a custom calculation created in a modeling language.
That abstraction makes the product easier to use, but it also creates limits. If you want a metric or dataset that the platform was never designed to support, you may have less freedom than you would in a general BI environment.
BI Gives You Flexibility, but Somebody Has to Own That Flexibility
There is a common assumption that BI means: Connect everything and build whatever you want. Technically, that can be true. Operationally, somebody still needs to do the work. Data sources need to be connected.
Tables need to be related. Duplicate entities need to be resolved. Metric definitions need to be agreed. Refreshes need to work. Permissions need to be managed. Reports need to be maintained.
Microsoft's star-schema guidance is a good illustration. Power BI models commonly distinguish between fact and dimension tables and require careful design to support reliable and efficient analysis.
That is completely reasonable for a business with analysts or data engineers. For a merchant who simply wants to know why sales declined last week, it may be unnecessary complexity.
What About Data Refresh?
Both categories need current information, but they often handle freshness differently. Purpose-built ecommerce analytics software usually defines the refresh process for the merchant. A BI environment gives the organization more architectural choices.
Power BI, for example, supports imported models that require refresh, along with DirectQuery and other modes that can query underlying data differently. Scheduled refresh and gateway configuration can also become part of the deployment depending on the data sources.
That flexibility matters when a business has requirements such as: Near real-time operational reporting, Large historical datasets, On-premises databases, Cloud warehouses, Different refresh schedules by dataset. But again, greater control creates more implementation responsibility.
Which Option Is Better for Custom Reporting?
BI wins when the definition of "custom" is very broad. Suppose management suddenly wants: Revenue by region, customer tenure, advertising channel, fulfillment method and gross margin band. If the underlying data exists, a properly designed BI model can potentially support that type of exploration.
Purpose-built ecommerce software may allow filters, date comparisons, segmentation and custom reporting, but the available dimensions usually remain connected to what the product has been designed to understand. That is not necessarily a weakness. Most ecommerce teams repeatedly ask a relatively predictable group of questions.
- Revenue.
- Orders.
- Customers.
- Products.
- Inventory.
- Checkout.
- Refunds.
- Returns.
- Marketing.
- Store performance.
Building an enterprise data model just to answer common commerce questions can be excessive.
Which Option Is Easier for a Store Owner?
Usually ecommerce analytics software. The interface is normally designed for merchants rather than professional analysts. Terms such as sales, customers, products and inventory are immediately recognizable.
The merchant should not need to understand joins, star schemas, semantic layers or query languages to answer an ordinary store question.
Modern BI products have made self-service analysis much more accessible, and Tableau explicitly describes modern BI as emphasizing flexible self-service analytics and empowering business users.
However, there is still a difference between using an already-built BI dashboard and building the analytical environment behind it. A manager can easily consume a well-designed BI dashboard. Creating and maintaining that environment is another matter.
Can Business Intelligence Replace Ecommerce Analytics Software?
Yes, in some organizations. If you already have a strong data team, warehouse, reliable ecommerce pipelines and a governed BI model, adding another ecommerce analytics product may duplicate functionality. Your team may already be able to build:
- Sales dashboards.
- Customer cohorts.
- Inventory reports.
- Product analysis.
- Marketplace views.
- Marketing performance.
- Executive reporting.
- The advantage is full control.
The disadvantage is that your organization owns the implementation. Every new commerce metric or integration may require development, testing and maintenance.
The question becomes: Do we want to build and maintain ecommerce intelligence ourselves? For some companies, the answer is absolutely yes. For others, buying that capability is much more practical.
Can Ecommerce Analytics Software Replace BI?
Sometimes, but only within the scope of the questions it is designed to answer. If your main reporting needs revolve around ecommerce performance, a commerce-focused platform may provide everything you need. But suppose leadership also wants to combine:
- Payroll.
- Manufacturing.
- Wholesale distribution.
- Customer-support staffing.
- Cash-flow information.
- CRM pipelines.
- Vendor performance.
- Physical retail.
- Corporate budgets.
Now you are moving outside ecommerce analytics and toward organization-wide business intelligence. BI is designed for that broader analytical role. The ecommerce platform can remain an important data source without becoming the analytics system for every department.
Do You Need BI for Multi-Store Reporting?
Not necessarily. Multi-store does not automatically mean enterprise BI. If an ecommerce analytics platform supports the stores, marketplaces and reporting questions you need, it may centralize them without requiring a custom BI implementation.
The challenge is not simply having multiple stores. The real difficulty appears when the data needs to be normalized across systems. For example:
- Are currencies different?
- Are product identifiers consistent?
- Are refunds treated the same way?
- Can customers be identified across channels?
- Do marketplace orders and direct-store orders use comparable definitions?
A BI platform gives you more flexibility to design those rules yourself. Purpose-built software can be easier when it already solves them for your intended use case.
Business Intelligence Makes More Sense When Ecommerce Is Only One Part of the Company
Imagine a manufacturer sells online through its own website, Amazon and distributors. Ecommerce is important, but management also needs production, procurement, supplier, logistics and wholesale data.
An ecommerce analytics platform may explain the online-store side very well. A BI environment can connect ecommerce with the rest of the company. That is one of the clearest situations where BI becomes valuable.
You are no longer asking: How is the store performing?
You are asking: How does ecommerce performance connect with the financial and operational performance of the company?
That is a broader business-intelligence problem.
Ecommerce Analytics Software Makes More Sense When the Main Problem Is Clarity
Now consider a growing online merchant. The business has good store data but the owner keeps moving between reports. They want to know:
- Why did revenue change?
- Which customers are returning?
- Which products are performing?
- What is becoming low in stock?
- Where are sales being lost?
The problem is not lack of analytical flexibility. The problem is that ordinary commerce questions require too much reporting work. That business probably does not need to start by hiring a data engineer and designing a warehouse.
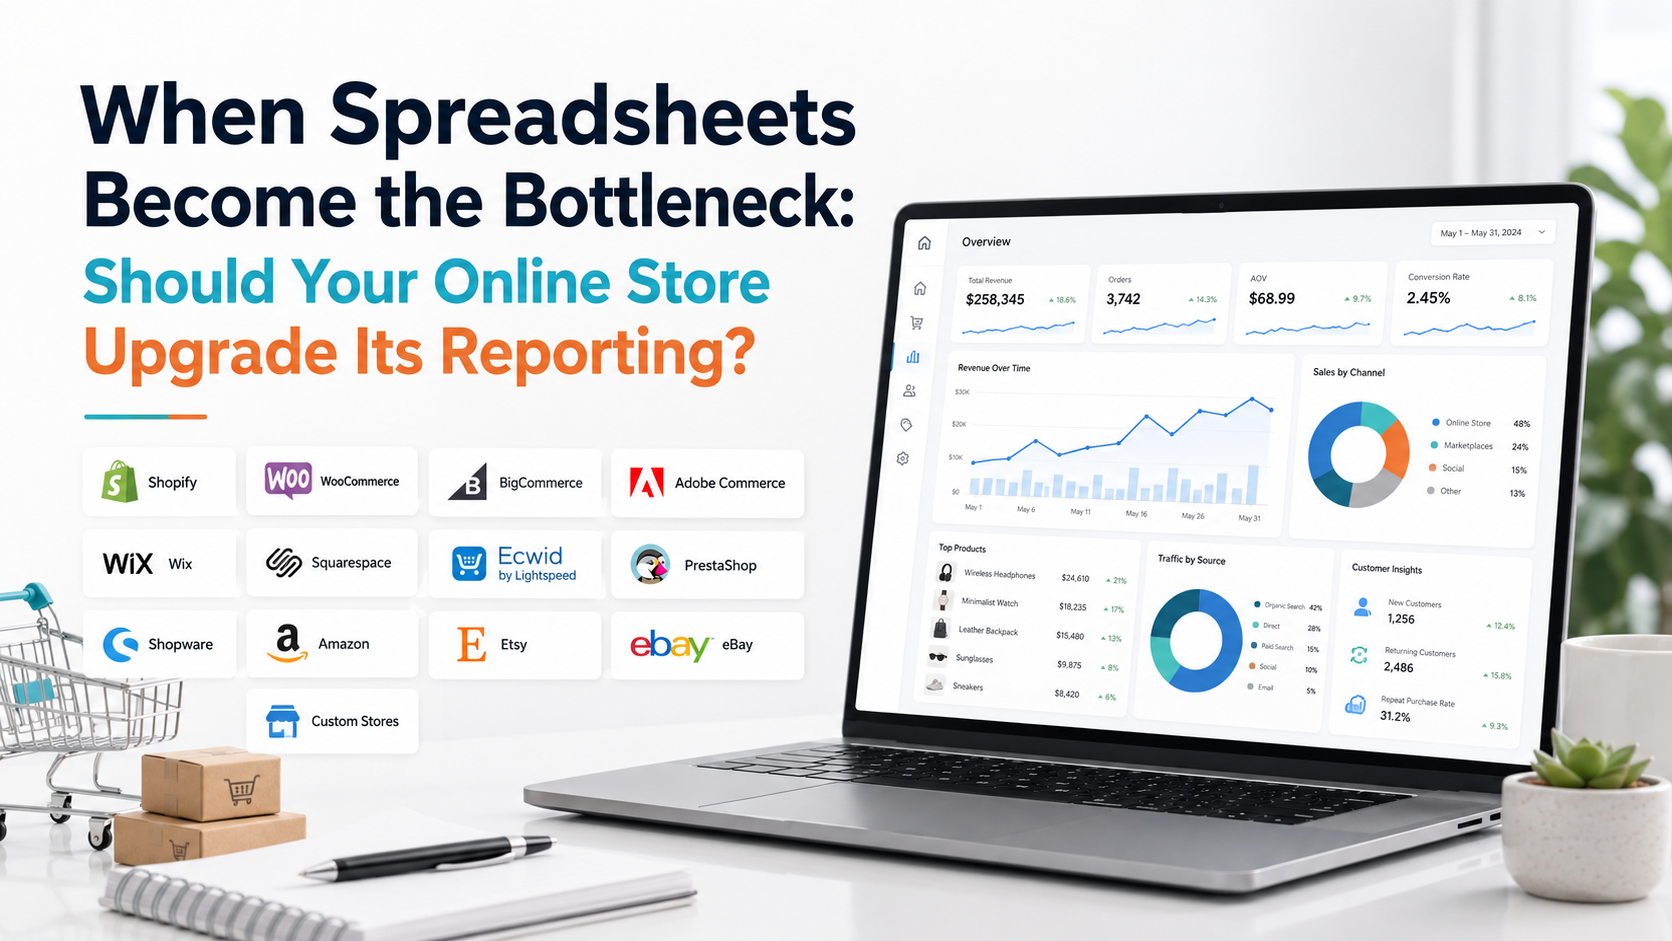
It needs an analytics layer that already understands ecommerce. For this type of reporting problem, read our guide on when an online store should stop relying on spreadsheets.
What About AI Features?
AI does not decide whether a product is ecommerce analytics software or BI. Both categories increasingly include AI. BI platforms are adding natural-language analysis, generated insights and AI-assisted reporting.
Microsoft describes Power BI semantic models as a foundation that can help AI answer questions consistently using governed business definitions.
Commerce-focused analytics can also use AI to explain store changes or answer questions from connected ecommerce information. The important test is not whether the product has an AI button. Ask:
- Does the answer use the right business data?
- Can I verify it?
- Does it respect the metric definitions?
- Does it clearly distinguish evidence from an assumption?
- Does it make analysis faster?
Generic AI advice does not become business intelligence simply because it appears beside a chart.
Do Not Choose BI Just Because It Sounds More Advanced
A sophisticated tool does not automatically produce sophisticated analysis. Imagine a store owner spends three months building a BI environment that eventually reproduces the same five reports already available in their ecommerce platform.
Technically, the system may be impressive. Commercially, very little has improved. The same mistake can happen in reverse.
A large enterprise might keep adding simple ecommerce reporting applications even though its real problem is inconsistent data across finance, stores, CRM and operations. Use the complexity of the business question to determine the complexity of the system.
Do Not Choose Ecommerce Software Only Because It Is Easier
Ease of use matters, but it is not the only criterion. Suppose your organization has highly specific calculations that directly affect financial reporting. If your analytics software cannot represent those definitions, convenience may become a limitation.
You should understand: Which metrics are built in, What can be customized, Which sources are supported, How historical data is handled, Whether raw data can be exported, How permissions work, How refresh timing works, What happens when your reporting needs become more advanced. This prevents a simple initial setup from becoming a constraint later.
Compare Total Cost, Not Just the Subscription
A BI product may appear inexpensive based on the software license. But the complete cost can include:
- Data engineers.
- Analysts.
- Warehouse infrastructure.
- ETL or ELT tools.
- Implementation.
- Model maintenance.
- Access management.
- Training.
- Ongoing report development.
Ecommerce analytics software may have a higher-looking monthly subscription than one BI seat but require far less implementation. The reverse can also happen.
A company that already has a warehouse and BI team may incur very little incremental cost by adding ecommerce reporting to the existing model. Cost should therefore be evaluated as total cost of ownership, not monthly software price alone.
When Ecommerce Analytics Software Is Usually the Better Fit
A purpose-built ecommerce analytics platform is often a stronger choice when:
- Your main questions concern ecommerce performance.
- You want useful reporting without building your own data model.
- The team does not have dedicated data engineers.
- You want faster implementation.
- Sales, customers, products and inventory are your primary analytical areas.
- Merchants or operators need to use the system directly.
- Prebuilt commerce metrics cover most of your decision-making needs.
The key word is prebuilt. You are choosing a product that has already done much of the ecommerce modeling work for you.
When a BI Tool Is Usually the Better Fit
Business intelligence becomes more attractive when:
- Ecommerce is only one of several major business functions.
- You need highly customized calculations.
- Multiple departments need governed access to shared data.
- The business already operates a data warehouse.
- Analysts need freedom to build new models and reports.
- Finance, ERP, CRM, operations and commerce need to be analyzed together.
- Data volume and complexity require a dedicated analytical architecture.
At that stage, flexibility and governance can outweigh the additional implementation effort.
The Best Answer Is Often a Hybrid
You do not always have to choose one category and remove the other. A mature business might use ecommerce analytics software for fast operational commerce questions and BI for enterprise-wide reporting.
For example: The ecommerce team monitors sales, customers, product performance and inventory in a commerce analytics environment.
Finance and executives use Power BI or another BI platform to connect ecommerce with accounting, ERP and company-level financial data. The same organization benefits from both systems because they operate at different levels.
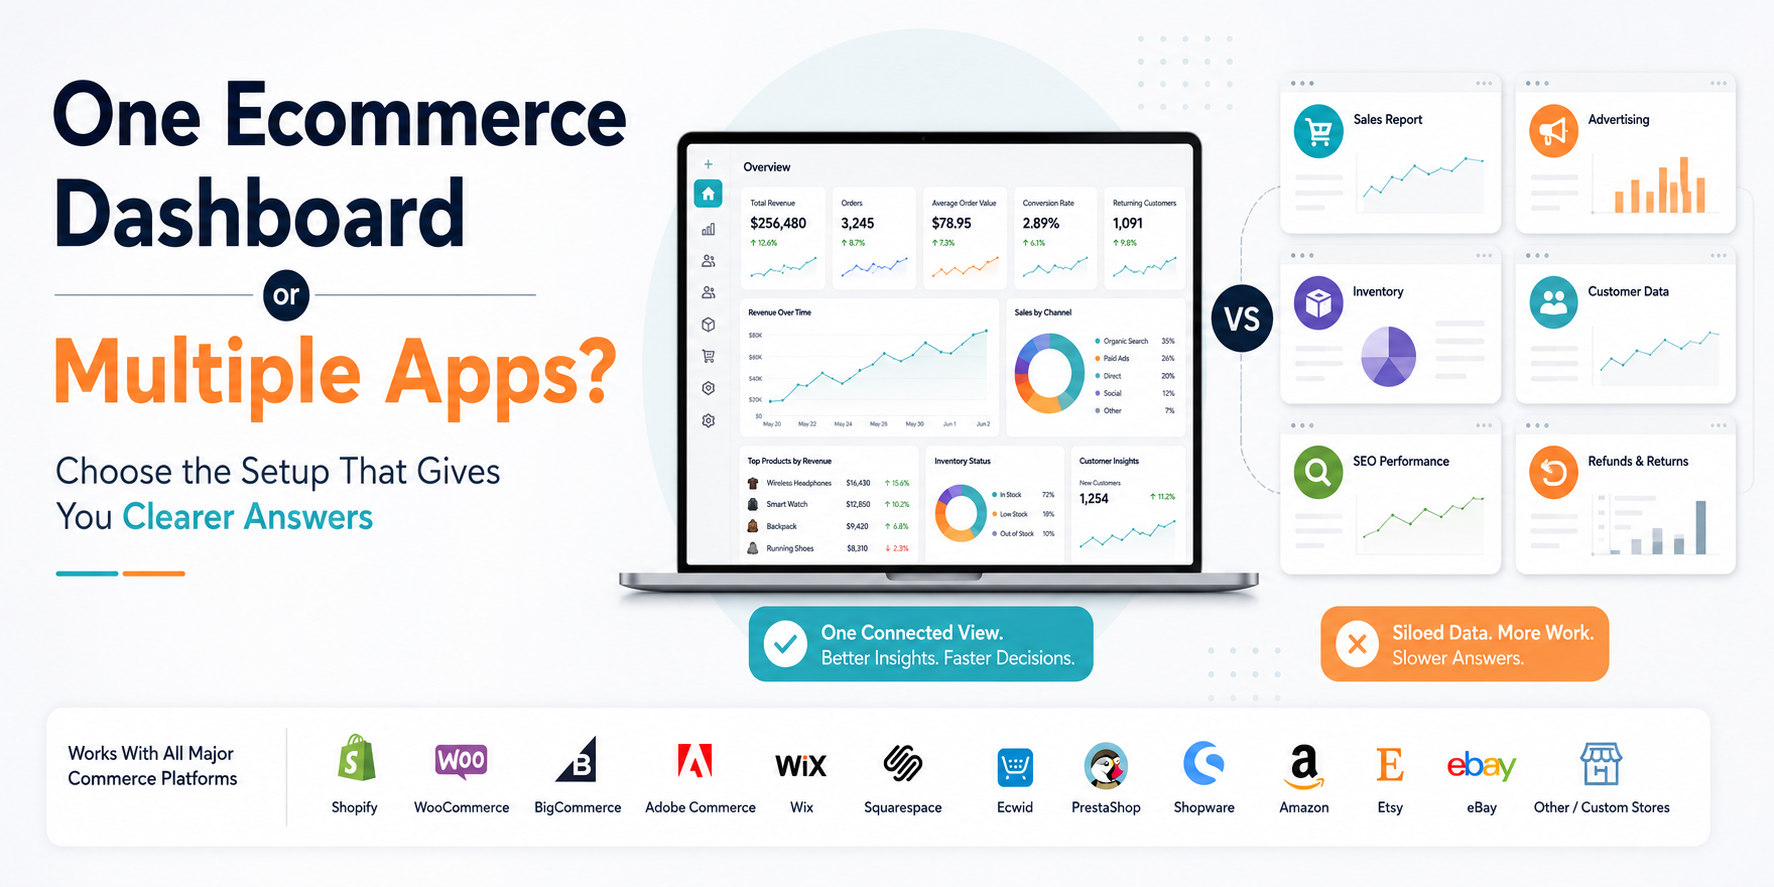
This is similar to the principle covered in our article on one ecommerce dashboard versus multiple apps: centralization is useful, but specialist capability should not be removed simply to reduce the number of tools.
A Practical Decision Example
Imagine two ecommerce companies each generate similar annual revenue.
Store A
It sells primarily online. Its team wants better visibility into revenue, customers, products, inventory and marketplace performance. There is no internal data engineering team. Most questions are commerce-specific. For Store A, purpose-built ecommerce analytics software is probably the more practical starting point.
Store B
It operates ecommerce, wholesale distribution and physical retail. Its data already flows into a warehouse. It has an analytics team. Management needs ecommerce performance connected with finance, suppliers, logistics and corporate planning. For Store B, BI is probably the stronger core architecture. Revenue size did not determine the answer. Reporting complexity did.
How to Decide Without Overcomplicating It
Ask these questions before buying either category:
- What are the ten most important questions we need analytics to answer?
- How many of those questions are purely ecommerce?
- How many require data from finance, CRM, ERP or other company systems?
- Do we already have a warehouse or governed data model?
- Who will build and maintain reports?
- How quickly do we need useful answers after implementation?
- How much custom modeling do we genuinely need?
- Would a prebuilt ecommerce model cover most of the work?
- What will the system cost after implementation and maintenance are included?
- Will our reporting needs become substantially more complex in the next few years?
Those answers usually make the choice clearer than a feature comparison.
The Choice Also Depends on Your Ecommerce Platform
This decision applies across businesses using Shopify, WooCommerce, BigCommerce, Adobe Commerce, Wix, Squarespace, Ecwid, PrestaShop, Shopware, Amazon, Etsy, eBay and other or custom ecommerce stores.
The available native reporting and accessible data vary by platform. A merchant selling through one straightforward storefront may have relatively simple analytical requirements. A business operating several storefronts plus Amazon and eBay may need stronger cross-channel reporting.
A custom commerce company may already have databases and infrastructure that naturally fit a BI environment. Do not choose the category from the platform name alone. Choose according to the data relationships and decisions your business needs to support.
Where Statty AI Fits
Statty AI is positioned on the ecommerce analytics software side of this comparison. It is designed to help ecommerce businesses understand store performance without first building a complete enterprise BI architecture.
For businesses using Shopify, WooCommerce, BigCommerce, Adobe Commerce, Wix, Squarespace, Ecwid, PrestaShop, Shopware, Amazon, Etsy, eBay and other or custom stores, the goal is to make important commerce signals easier to analyze within a connected store-intelligence environment.
You can explore Statty AI analytics features or visit Statty AI to see how its ecommerce-focused approach differs from building a general-purpose BI stack. For a closer look at what that reporting environment should contain, read What Should an Ecommerce Analytics Dashboard Actually Show?.
Final Thoughts
The difference between ecommerce analytics software vs business intelligence tools is not that one is basic and the other is advanced. They begin with different assumptions. Ecommerce analytics software assumes you want to understand an ecommerce business quickly.
Business intelligence assumes you want the flexibility to model and analyze almost any business data. Choose ecommerce analytics software when commerce is the main analytical problem and you want prebuilt answers with less implementation.
Choose BI when your questions cross several departments, your metrics require custom modeling and your organization has the people and infrastructure to manage a broader analytical environment.
Use both when the business genuinely operates at both levels. The best analytics stack is not the one with the most technical capability. It is the one that gives your team enough flexibility to answer the questions that matter, without creating more data work than the business actually needs.