Most ecommerce businesses do not deliberately decide to build a complicated analytics stack. It happens gradually. You install one tool for sales reporting, another for customer retention, another for inventory, one for SEO, another for marketing attribution and perhaps another because someone on the team needed a report the other tools could not produce.
Each application solves a real problem. Then one day you need to answer a simple question: Why did store revenue fall last week?
Sales are in one application. Customer information is somewhere else. Inventory has its own dashboard. Marketing data lives in another platform. Refund information needs another report. The problem is no longer lack of data.
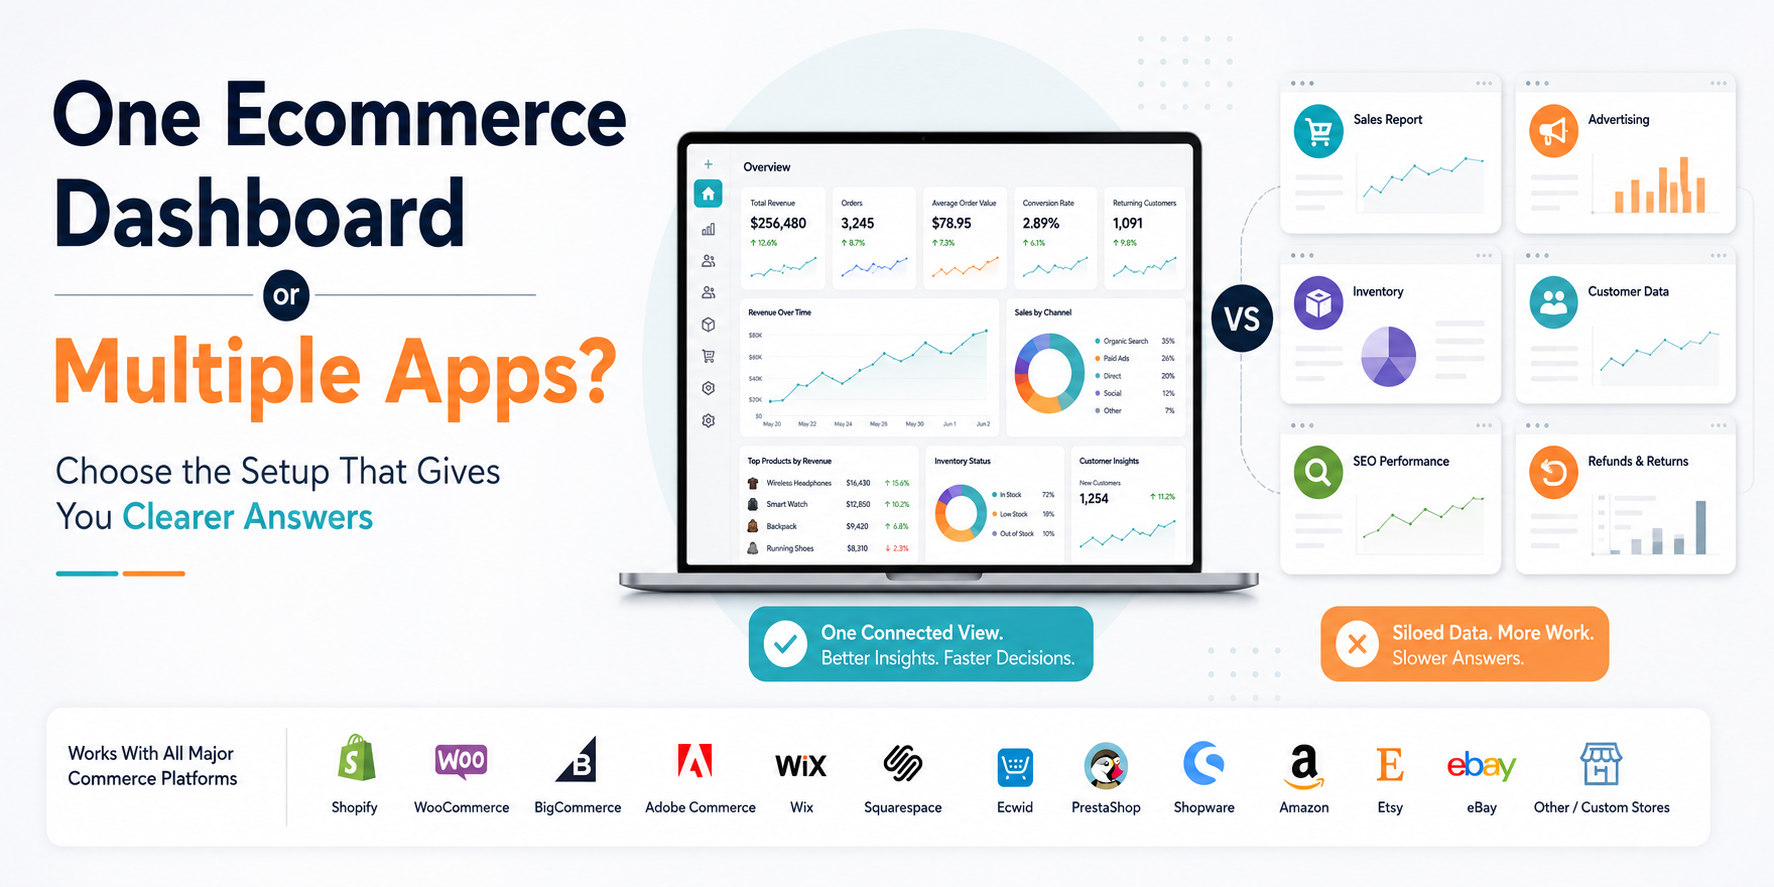
It is deciding whether your ecommerce business is better served by an all-in-one ecommerce dashboard or by several specialized applications. There is no universal winner.
One central dashboard usually provides better visibility and consistency. Multiple apps can provide deeper specialist functionality. For many growing businesses, the best answer is actually somewhere between the two.
First, One Dashboard Does Not Necessarily Mean One Application
This distinction matters. A centralized dashboard does not mean one piece of software must perform every business function. Your store might still use:
- A dedicated advertising platform.
- An email marketing system.
- A customer-support application.
- An inventory or warehouse system.
- Your ecommerce platform.
- A marketplace advertising tool.
The dashboard's role can simply be to bring the relevant performance data from those systems into one analytical view. Adobe Commerce Intelligence, for example, is designed to consolidate multiple data sources, model the information and provide a single reporting environment.
Adobe specifically describes this as maintaining a single source of truth while still allowing different reports and dashboards to sit on top of the underlying data. That is different from expecting one application to replace every operational tool your business uses.
The better question is therefore: Do we need one tool for everything, or one place to understand everything? Those are not the same requirement.
Why One Dashboard Becomes Attractive as a Store Grows
A centralized dashboard becomes useful when business questions begin crossing departmental boundaries. Imagine sales fall 12%. The sales report tells you the result. To understand it, you might need to know:
- Did traffic fall?
- Did conversion weaken?
- Did returning customers purchase less?
- Did one important product lose sales?
- Was that product out of stock?
- Did refunds increase?
A dashboard becomes valuable when these signals are close enough together that you can move through the investigation without rebuilding the business story manually.
Shopify's current Analytics environment follows this general overview-to-detail model. Merchants can customize metric cards, compare periods and move directly from dashboard cards into underlying reports.
WooCommerce similarly provides a customizable analytics overview that leads into detailed reports covering areas including orders, customers, products, revenue and stock. The underlying principle is useful regardless of platform: Keep monitoring centralized. Keep deeper investigation available.
One Dashboard Makes Metric Relationships Easier to See
This is usually the strongest reason to centralize ecommerce analytics. Imagine three apps show: Sales: down 9%. Returning customers: down 14%. A best-selling product: out of stock for five days. Viewed separately, these are three unrelated alerts.
Viewed together, they create a much more useful hypothesis. Perhaps lower returning-customer activity was concentrated among customers who normally purchase the unavailable product. That does not prove causation.
But it gives you a much better investigation path. This is why connected analytics differs from simply having several dashboards open in browser tabs. The value comes from seeing relationships between the numbers.
For more on how these relationships should be presented, see our guide to what an ecommerce analytics dashboard should actually show.
Consistent Metric Definitions Become Easier to Maintain
Multiple analytics tools can calculate similar metrics differently. One application may display gross sales.
- Another may use net sales.
- Another may subtract refunds based on refund date.
- Another may associate them with the original order period.
Even native commerce platforms document different definitions for metrics such as sales and revenue. WooCommerce, for example, separately defines gross sales and total sales in its Analytics reporting.
Now imagine several third-party applications applying their own business logic on top of the same store data. The result can be meetings where people ask: Why does App A say revenue was $84,000 while App B says $81,500? A centralized analytical model can reduce that problem when important metrics are defined consistently.
Microsoft describes semantic models in Power BI as a business-friendly layer where relationships and commonly used calculations can be defined once and reused across reports, supporting more consistent analysis.
But there is an important condition. Putting all your charts on one screen does not automatically create a single source of truth. The underlying definitions still need to be correct.
One Dashboard Can Reduce Context Switching
Consider a weekly reporting workflow. The store manager checks the ecommerce platform. Then customer analytics. Then inventory software. Then SEO. Then advertising. Then spreadsheets containing calculations that do not exist in any of those systems.
The manager is not necessarily performing analysis during much of that time. They are assembling context. A central dashboard can shorten that process by surfacing the important signals first. Revenue changed. Customer mix changed.
Product X contributed most of the decline. Inventory on Product X was unavailable. Now the team knows which specialist system needs to be opened. The central dashboard has not replaced every application.
It has helped decide which application deserves attention. This is a natural next step for businesses that have already reached the limitations discussed in our guide on when ecommerce stores should stop relying on spreadsheets for reporting.
One Dashboard Can Simplify Management Reporting
Executives generally do not need to operate every specialist tool. They need answers.
- What happened?
- What changed?
- Where is the risk?
- What deserves attention?
Adobe's Commerce Intelligence documentation makes this distinction clearly. Its executive overview is designed as a high-level view, while other dashboards contain more detailed information.
Microsoft recommends the same philosophy for business dashboards: show the most important information in one overview and allow users to move into underlying reports when they need details.
This is especially useful when leadership needs to understand the whole ecommerce business rather than become an expert in every operational platform.
So Why Not Put Everything Into One App?
Because specialization still matters. An application designed specifically for attribution may provide capabilities that a broad ecommerce analytics dashboard does not.
A dedicated SEO platform may provide keyword research, crawling, backlink analysis and technical auditing far beyond what an ecommerce intelligence dashboard needs.
A warehouse management system may handle purchase orders, locations, transfers and replenishment workflows much more deeply.
A specialist customer platform may offer sophisticated lifecycle automation. Trying to replace every one of these applications with one broad product can create the opposite problem.
You gain simplicity but lose depth. That is why "all-in-one" should not automatically mean: We will never need another application again. A better interpretation is:
The main business signals can be understood from one place, while specialist tools remain available where deeper functionality genuinely matters.
When Multiple Apps Are the Better Choice
Multiple specialized applications make sense when your business needs depth that a general platform cannot provide. Consider an ecommerce company with an advanced performance-marketing team.
Its attribution specialists may need campaign-level models, assisted-conversion analysis and advertising integrations that the general store dashboard does not provide. The SEO team may need a dedicated crawler and technical SEO platform.
Finance may use an accounting or profitability system with financial logic that should not be recreated inside a general analytics tool. Operations may depend on a warehouse management platform.
Replacing those tools just to reduce the number of subscriptions would probably make the business less capable. The correct test is not: How many apps do we have? It is: Does each app perform a distinct job that matters?
How Many Ecommerce Apps Is Too Many?
There is no magic number. Five applications can be perfectly manageable if they have clearly separated responsibilities. Three can already be too many if all three calculate the same sales metrics and nobody knows which one to trust. The warning signs are usually operational.
You have too many overlapping tools when teams repeatedly check multiple apps to answer the same question, maintain several versions of the same metric, manually reconcile conflicting reports or pay for significant functionality they rarely use.
Another warning sign is duplicated responsibility. If three applications all claim to be your primary sales dashboard, the problem may not be the number of tools. The problem is that none has a clearly defined role.
The Hidden Cost of Multiple Apps Is Not Only Subscription Fees
Businesses often compare software costs like this:
- App A: $49
- App B: $79
- App C: $99
- Total: $227 per month.
That is useful, but incomplete. The real cost can also include setup, training, data reconciliation, integration maintenance and the time employees spend moving between systems. Suppose your ecommerce team spends four hours every week collecting numbers from several applications for one management report. That is more than 200 hours across a year.
The reporting stack should therefore be evaluated by total operational cost, not simply subscription price. At the same time, one expensive all-in-one system can be wasteful if the business only uses 20% of its functionality. Lower app count does not automatically mean lower cost.
Multiple Apps Also Mean Multiple Data Relationships
Each external application needs some way to obtain the information required for its function. That can mean APIs, platform permissions, tracking scripts, pixels or account connections depending on the application.
For example, Shopify requires merchants to review an app's requested access before installation. Merchants can later review individual third-party apps for their permissions, privacy details, billing and recent activity.
This does not mean installing multiple apps is inherently unsafe. It means each additional tool creates another relationship that needs to be understood and managed. Ask:
- What data does this application need?
- Why does it need it?
- Can it edit store information or only read it?
- Who on the team can access it?
- What happens to the data if the application is removed?
A simpler stack can make governance easier, but the correct goal is appropriate access rather than an artificially low app count.
Does One Dashboard Automatically Create Better Data?
No. This is an important limitation of all-in-one analytics. If the underlying connections are incomplete, a centralized dashboard may simply centralize bad information. Imagine your advertising source has stopped syncing.
Inventory is delayed by six hours. Customer identities are duplicated. Refund calculations use different date logic. The dashboard may look beautifully consistent while the underlying information is not. A central dashboard therefore needs strong data foundations. Check:
- How recently did each source update?
- Are important metrics defined consistently?
- Are product identifiers mapped correctly?
- How are currencies handled?
- How are refunds and cancelled orders treated?
- How are customers identified across platforms?
One dashboard is valuable only if centralization improves understanding rather than hiding inconsistencies.
What About Built-In Ecommerce Analytics?
Before adding either one new dashboard or several specialist apps, check what your ecommerce platform already provides. Shopify currently provides a customizable Analytics dashboard with sales, sessions, fulfillment information, time comparisons, reports and generated insights.
WooCommerce includes customizable analytics covering performance, charts, leaderboards and deeper reports. BigCommerce provides built-in ecommerce analytics covering areas including orders, sales channels, storefront conversion and AOV, with deeper product and customer reporting also available.
Adobe Commerce Intelligence supports consolidated data, dashboards, reporting and customer, merchandising and executive analysis.
For some merchants, the platform's native analytics already answers their most important questions. Adding another tool simply because "every serious store needs analytics software" would create complexity without solving a real problem.
When Native Analytics Is Enough
Native reporting may be sufficient when you sell mainly through one platform, have a relatively straightforward business model and can answer important questions without regularly exporting or reconciling additional data.
If you can easily understand sales, orders, customers, products and the performance signals you actually use, there is little benefit in replacing a system that works. The need for another layer usually appears when questions start crossing the limits of native reports. For example:
- How did product availability affect returning-customer revenue?
- Which customer group contributed most to a sales decline?
- What changed across several stores or marketplaces?
- Which issue deserves management attention first?
That is where connected analytics can add more value.
A Specialized App Should Earn Its Place
A useful rule for any ecommerce tool is: Every specialist app should own a clear problem. For example:
- SEO platform: technical SEO and search research.
- Accounting platform: financial records and reconciliation.
- Advertising platform: campaign execution and detailed media analysis.
- Inventory system: operational inventory management.
Central analytics dashboard: cross-functional performance monitoring and investigation. When you can clearly explain why each tool exists, multiple applications are not a problem. When two or three products all own the same responsibility, rationalization may be useful.
The Hybrid Model Is Often the Most Practical
For many established ecommerce businesses, the real choice is not one dashboard or multiple applications. It is: One central analytics layer plus specialist applications. The central environment answers:
- What happened?
- Which part of the business changed?
- Where should we investigate?
The specialist application answers the deeper question. Suppose organic traffic falls. The central dashboard detects the commercially meaningful decline. The SEO team opens its specialist platform to investigate rankings, crawling or technical issues.
Suppose stockout risk increases. The dashboard highlights the affected high-revenue products. Operations moves into its inventory system to place purchase orders or transfers. Suppose paid customer acquisition deteriorates.
The dashboard identifies the business impact. The marketing team uses its advertising and attribution platforms for deeper campaign optimization. This structure preserves specialist depth while reducing reporting fragmentation.
What Happens When You Sell on Multiple Platforms?
The case for a centralized analytical layer becomes stronger when the business operates across several ecommerce environments. A merchant may sell through a direct website plus Amazon and eBay.
Another may manage several regional storefronts. Another may operate Shopify and a wholesale channel. Now the business needs to answer questions at two levels.
- Platform level: How is each store or marketplace performing?
- Business level: How is the overall ecommerce operation performing?
If every platform is analyzed completely separately, management can struggle to understand the whole business. But multi-platform reporting also introduces normalization challenges.
- Order statuses may differ.
- Product identifiers may differ.
- Fees may differ.
- Customer data availability may differ.
- Currencies and time zones may differ.
The goal of a central dashboard is not simply to add every platform's revenue together. It is to make those sources comparable enough to support a reliable business view.
One Dashboard Does Not Mean Every Platform Should Look Identical
This matters for businesses using Shopify, WooCommerce, BigCommerce, Adobe Commerce, Wix, Squarespace, Ecwid, PrestaShop, Shopware, Amazon, Etsy, eBay and custom ecommerce stores.
A Shopify store and an Amazon marketplace account do not provide exactly the same information. Your direct website may offer detailed customer journeys and site behavior. A marketplace may provide a different set of listing, advertising and transaction signals.
A useful cross-platform dashboard should preserve these differences rather than pretending every platform produces identical data. Standardize what is genuinely comparable. Keep platform-specific information where it adds value.
Should You Replace Google Analytics With an Ecommerce Dashboard?
Usually, that is the wrong way to think about the decision. Google Analytics is designed around web and app behavior measurement. Your ecommerce dashboard may focus on commercial performance, customers, products, inventory and operational signals.
There may be overlap, but their purposes are not necessarily identical. A central ecommerce dashboard can use high-level traffic and conversion information to support commercial analysis while Google Analytics remains available for deeper website behavior investigation.
The same applies to dedicated SEO, advertising and financial applications. Centralization should reduce unnecessary switching. It should not remove specialist capability the business still needs.
When Is One Dashboard Clearly the Better Choice?
A centralized ecommerce dashboard becomes particularly attractive when your main challenge is fragmented understanding.
You have plenty of tools. You can find almost any number eventually. But answering a cross-functional question takes too long. This often appears when:
- The same metrics are recreated across several applications.
- Weekly reporting requires manual consolidation.
- Teams disagree about which figures are authoritative.
- Management needs one clear view of overall performance.
- Product, customer and inventory signals need to be analyzed together.
- The business operates across several stores or channels.
- Employees spend more time finding data than interpreting it.
When these symptoms appear, the problem is rarely another missing chart. It is reporting architecture.
When Are Multiple Apps Clearly Better?
Keep specialized tools when they provide important capabilities that the central analytics environment cannot reproduce well.
That may include advanced accounting, warehouse operations, technical SEO, marketing automation, attribution, customer support or enterprise business intelligence.
Do not consolidate simply for the aesthetic satisfaction of having fewer icons in your app menu. Every consolidation should answer: What work becomes easier without creating a new capability gap?
If removing an app saves $50 per month but forces an employee to spend five additional hours rebuilding its reports, the consolidation is not an improvement.
How to Choose the Right Setup
Before changing your analytics stack, answer these questions:
- Which business questions take too long to answer today?
- Which tools currently answer the same questions?
- Which applications provide genuinely unique functionality?
- Where do metric definitions conflict?
- How much manual reporting work exists because data is fragmented?
- Which information needs to be visible centrally, and which belongs in specialist systems?
- Would consolidation reduce work without removing capabilities people actually use?
The answers usually reveal whether you need a new all-in-one system, fewer applications or simply better coordination between the tools you already have. For deciding which signals deserve centralized visibility, see Your Store Has Plenty of Data: Which Numbers Actually Matter?.
A Practical Example
Imagine a growing ecommerce business sells through its website and two marketplaces. The team currently uses: One native store analytics dashboard. A customer analytics tool. An inventory application. An SEO platform. Two marketplace dashboards. Google Analytics. Several spreadsheets. The answer is not to replace all seven systems.
Instead, the business centralizes the metrics used for weekly management: revenue, orders, customers, product performance, stock risk, refunds and major marketplace trends. The SEO tool remains because the SEO team needs its specialist capabilities.
The inventory system remains because operations still needs purchasing and stock-management functionality. Google Analytics remains available for detailed website behavior.
The marketplaces continue handling marketplace-specific operations. But management no longer needs to open every system to understand how the business performed. That is a successful centralization strategy. The company reduced reporting fragmentation, not specialist capability.
Where Statty AI Fits
Statty AI is designed to serve as a connected ecommerce intelligence environment for businesses operating across Shopify, WooCommerce, BigCommerce, Adobe Commerce, Wix, Squarespace, Ecwid, PrestaShop, Shopware, Amazon, Etsy, eBay and other or custom ecommerce stores. The purpose is not to suggest that every specialist business application should disappear.
It is to make important ecommerce performance signals easier to understand from one analytical environment, particularly when sales, customers, products, inventory and other store information would otherwise need to be investigated separately. You can explore Statty AI analytics features or visit Statty AI to learn more about its approach to connected ecommerce analytics.
Final Thoughts
The debate between one ecommerce dashboard vs multiple apps has no universal winner. A single dashboard is better when your main problem is fragmented reporting, inconsistent metrics and too much time spent assembling the business picture.
Multiple applications are better when each tool provides specialist capability that the business genuinely needs. For many ecommerce stores, the strongest setup is a hybrid: One central place to understand performance. Specialist tools for specialist work.
That approach avoids two extremes. You do not force one application to perform every job badly. You also do not require people to open eight systems just to understand why sales changed. The goal is not to have the fewest apps. It is not to have the most advanced stack either.
The better ecommerce analytics setup is the one where every tool has a clear responsibility, important metrics use trusted definitions and the team can move from "something changed" to "this is what we should investigate" without rebuilding the answer manually every time.