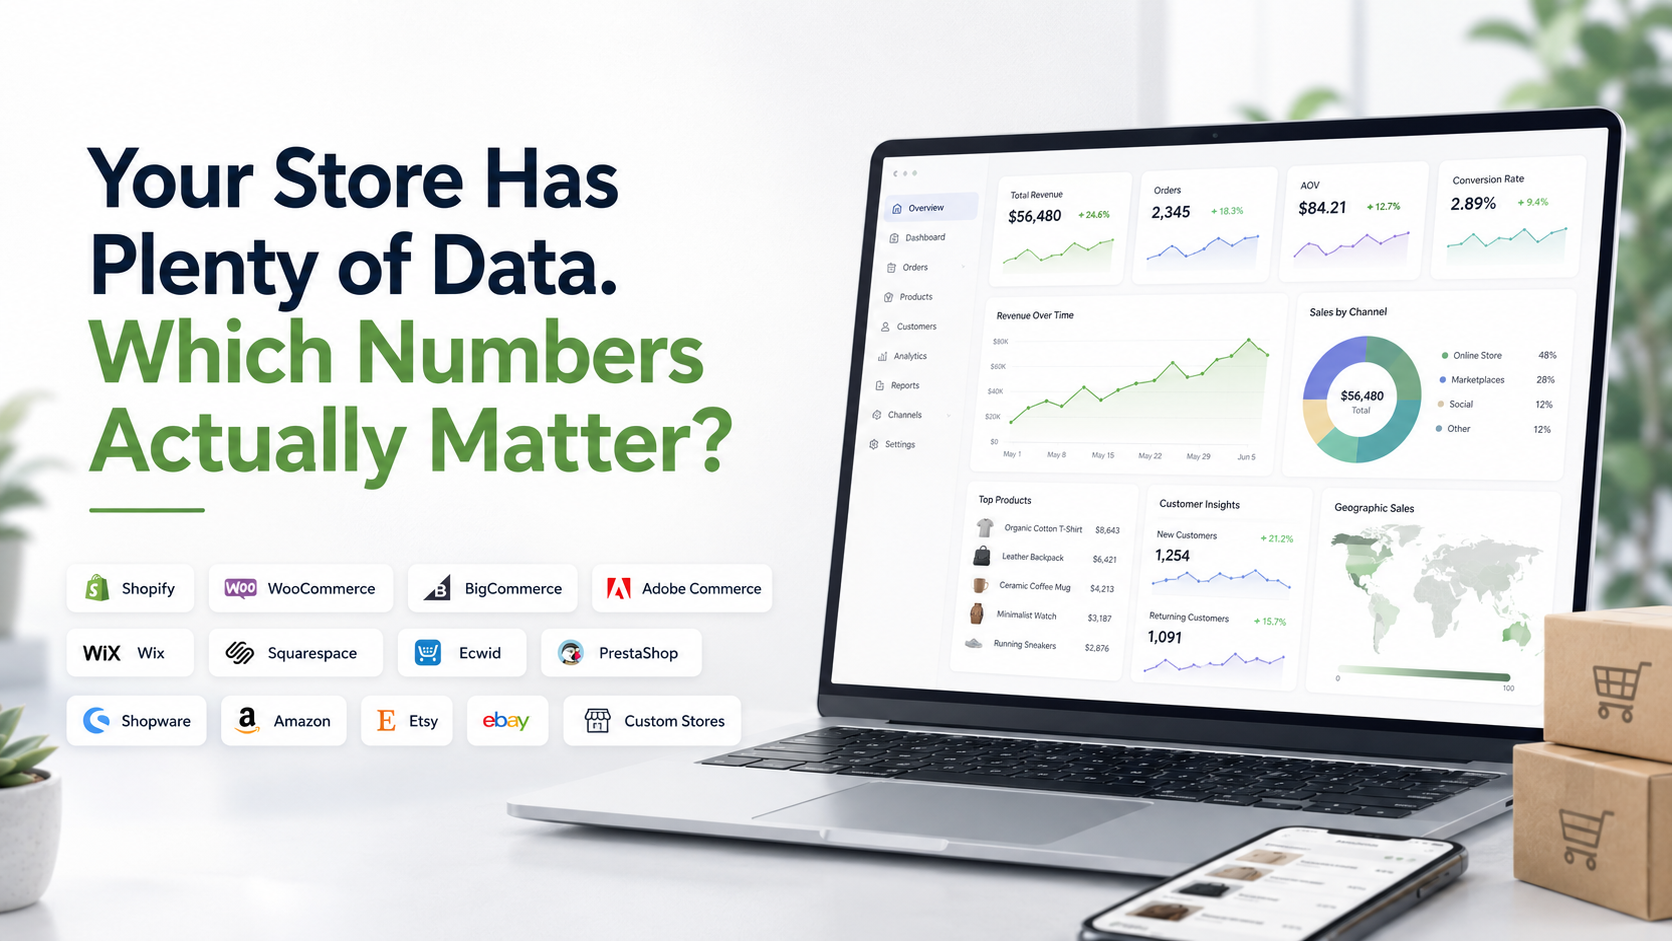
Open almost any ecommerce dashboard and you can find more numbers than you realistically have time to use. Revenue. Orders. Average order value. Conversion. Returning customers. Refunds. Product sales. Inventory. Stockouts. Abandoned checkouts. Customer segments. Marketing performance. Search visibility. The problem is no longer getting data.
The problem is deciding which numbers actually deserve your attention. And the answer is not “track everything.” The ecommerce metrics that matter are the ones connected to a decision you may actually make. If a number changes and you would not do anything differently because of it, that metric probably does not deserve a permanent place on your main dashboard.
Start With Decisions, Not Metrics
A useful store dashboard should help you answer business questions. Before choosing metrics, ask what decisions you regularly need to make. For example:
- Is the store actually growing?
- Are customers spending more or less?
- Are people coming back after their first purchase?
- Which products deserve more inventory?
- Which products are tying up stock without selling?
- Where are potential orders being lost?
- Are refunds weakening otherwise strong sales?
- Which customer groups deserve more attention?
Once the question is clear, the metrics become much easier to choose. If your question is whether revenue growth is healthy, you may need revenue, orders and average order value.
If you are deciding what to reorder, revenue alone is not enough. You need product demand, current inventory and sales velocity. A metric should exist on your dashboard because it helps answer something not because the ecommerce platform happens to provide it.
Use a Metric Hierarchy Instead of a Huge Dashboard
One practical way to organize ecommerce data is to separate metrics into three levels.
Level 1: Outcome Metrics
These tell you what happened to the business. Examples include:
- Revenue
- Orders
- Customers
- Refund or return value
These numbers are important, but they normally tell you the result, not the cause.
Level 2: Driver Metrics
These help explain why the outcome changed. Examples include:
- Average order value
- New versus returning customers
- Product revenue
- Units sold
- Checkout completion
- Inventory availability
If revenue changed, this is usually where you start looking for the explanation.
Level 3: Diagnostic Metrics
These help you investigate a specific problem more deeply. Examples might include:
- Which product lost the most revenue
- Which customer segment became less active
- Which variants repeatedly went out of stock
- Which products generated unusually high refunds
- Which channel experienced the largest drop
You do not need every diagnostic number on your main dashboard. Bring them in when a Level 1 or Level 2 metric gives you a reason to investigate. That keeps your analytics useful rather than overwhelming.
Revenue Matters, but Only as a Starting Point
Revenue is one of the most important ecommerce metrics because it summarizes how much selling activity the store generated. But it is also one of the easiest numbers to misread. Imagine revenue increased 14%. That sounds positive.
But perhaps order count increased 25% while average order value dropped sharply. Or a short promotional campaign created most of the increase. Or one unusually large order distorted the month.
The useful question is not: Did revenue increase? It is: What created the revenue change, and is that change something we can repeat?
This is why revenue belongs at the top of your metric hierarchy, but it should rarely be analyzed by itself. Our Shopify sales analytics guide goes deeper into how sales metrics interact when you need to investigate that relationship specifically.
Orders Tell You Whether More Purchases Are Happening
Revenue can increase without a meaningful increase in the number of people buying. Order count helps separate transaction growth from spending growth. Suppose:
- Revenue increases 12%
- Orders increase 11%
- Average order value remains nearly unchanged
That looks like fairly straightforward transaction growth. Now suppose:
- Revenue increases 12%
- Orders increase 1%
- Average order value increases strongly
The same revenue result now has a different explanation. Neither pattern is automatically better. The important point is understanding what kind of growth you are looking at.
Average Order Value Matters When Revenue and Orders Move Differently
Average order value becomes useful when order volume does not explain the change in revenue. If orders stay relatively stable but revenue falls, AOV deserves attention. The next question is why customers are spending less. Possible reasons include:
- Higher-value products selling less
- More discounting
- Smaller baskets
- Premium products being unavailable
- A shift toward lower-priced products
AOV should therefore be treated as an investigative metric rather than a score that always needs to increase. A higher average order value is not automatically good if the store lost a large number of orders at the same time.
New Customers Tell You About Acquisition. Returning Customers Tell You About the Relationship.
Customer count can look impressive while hiding weak customer quality. Suppose your store added 1,500 new customers this month. That sounds like growth.
But if very few previous customers returned, acquisition may be replacing lost repeat business rather than creating stronger overall customer growth. This is why you should separate:
- New customers: Are we continuing to attract buyers?
- Returning customers: Are previous buyers coming back?
The relationship between the two gives you much more information than total customer count. Our Shopify customer analytics guide explores this area in more detail, including repeat behavior, cohorts and customer value.
Retention Matters Most When You Measure It Over Enough Time
Customer retention is valuable, but it can become misleading when measured too early. If a product is normally repurchased every three months, evaluating retention 20 days after the first purchase tells you very little.
Retention should match the natural purchase cycle of the business. Instead of watching a retention percentage every day, compare similar customer groups after they have had enough time to return.
You may find that customers acquired in one month return much more often than customers acquired through another campaign.
That tells you something about acquisition quality that a first-order conversion number cannot. For a dedicated measurement framework, see our Shopify customer retention analytics guide.
Product Revenue Matters More Than a “Bestseller” Label
“Best-selling product” sounds useful, but it can mean several different things. One product may sell the most units. Another may generate the most revenue. A third may be responsible for stronger repeat purchases.
So rather than relying only on a bestseller ranking, look at the product question you are trying to answer. If you are deciding where to put marketing attention, product revenue may matter.
If you are deciding what to reorder, units sold and stock availability become important. If you are deciding whether a product is creating customer problems, refund or return activity may be more useful. There is no single product metric that answers every product decision.
Inventory Numbers Matter Only When You Add Demand
Inventory is another area where raw numbers can create the wrong impression. Thirty units sounds healthy until you discover the product sells ten units a day.
The same thirty units could be excessive for a product selling once every two months. That is why inventory should be connected with:
- Recent sales velocity
- Revenue contribution
- Available stock
- Supplier lead time
- Incoming inventory
The useful question is not simply: How much stock do we have? It is: Is the amount of stock appropriate for the rate at which this product is selling? Our Shopify inventory analytics guide explains how to analyze inventory without treating every SKU the same.
Low Stock Is a Signal Only When the Threshold Means Something
A low-stock warning can be valuable, but an arbitrary threshold creates noise. If every product triggers a warning at five units, you may receive unnecessary alerts for slow-moving products and dangerously late alerts for bestsellers.
A useful low-stock threshold considers demand and replenishment time. That turns: Five units remaining into: This product may run out before replacement inventory can arrive. That is a much more useful business signal.
For stores that need a dedicated workflow, our Shopify low-stock alert guide explains thresholds, lead time, safety stock and alert setup in more detail.
Refunds Tell You Whether Completed Sales Are Staying Completed
Revenue looks at selling activity. Refunds help tell you what happens after some of those sales. If revenue rises by 15% but refunded value rises much faster, the growth may deserve closer attention.
Do not stop at the total refund number either. Break the issue down by product where possible. If most refunds are concentrated around one item, you may have a product-specific issue rather than a store-wide problem. Refunds become particularly useful when they help narrow the investigation.
Abandoned Checkouts Matter When They Lead to a Decision
Abandoned checkout numbers often attract attention because they represent shoppers who showed relatively strong buying intent but did not complete the order. But seeing a large abandoned-checkout count is only the beginning. Useful questions include:
- Is abandonment getting worse?
- Is checkout recovery improving?
- Did the change happen during a particular promotion?
- Are checkout problems affecting a specific group or period?
- How much potential revenue is being recovered later?
Do not treat every abandoned checkout as guaranteed lost revenue. Some customers were not going to complete the purchase regardless. Use the metric as a signal about where buying intent is failing to convert into completed orders.
Conversion Rate Matters, but It Cannot Explain Everything
Conversion rate is one of the most widely watched ecommerce KPIs. It is useful because it connects buying activity with the volume of people reaching the store. But a change in conversion does not automatically tell you why it changed.
Traffic quality may have shifted. Prices may have changed. Inventory may be limited. A promotion may have ended. Mobile traffic may behave differently from desktop traffic. Conversion should therefore be interpreted with context rather than treated as a standalone score.
A “good” conversion rate is also highly dependent on product type, price, traffic source, geography and customer intent. Your own historical baseline is usually more useful than chasing a generic benchmark.
Some Metrics Matter Only at Certain Stages of Growth
A small store and a mature ecommerce business do not need exactly the same dashboard. An early-stage store may focus heavily on:
- Revenue
- Orders
- Conversion
- Product demand
- Initial repeat purchases
A larger store may need more attention on:
- Customer retention
- Segment revenue
- Product-level profitability
- Inventory planning
- Refund patterns
- Channel performance
- Cohort behavior
As the business becomes more complex, the number of questions increases. But that does not mean the main dashboard should become more crowded. Advanced businesses often benefit even more from separating executive metrics from diagnostic reports.
Your Platform Changes. The Business Questions Do Not.
Statty AI is designed for ecommerce businesses across multiple store environments, including Shopify, WooCommerce, BigCommerce, Adobe Commerce, Wix, Squarespace, Ecwid, PrestaShop, Shopware, Amazon, Etsy, eBay and other/custom stores.
The names and exact reporting structures may differ between platforms, but the underlying business questions remain familiar.
- A WooCommerce merchant may still need to know why revenue declined.
- An Amazon seller still needs to understand product demand and inventory risk.
- An Etsy seller still needs to identify which products generate meaningful sales.
- A BigCommerce store still needs to understand whether customers are returning.
The platform changes. The need to separate useful signals from reporting noise does not. You can explore how Statty AI approaches connected store intelligence on the Statty AI website and review its current analytics features.
Build a Dashboard Around Exceptions
One of the best ways to reduce reporting overload is to stop treating every metric as something you must actively analyze every day. Instead, monitor a smaller set of important metrics and investigate when one moves outside its normal range. For example:
- Revenue falls significantly → check orders and AOV.
- Orders remain stable but revenue falls → investigate basket value and product mix.
- A bestseller loses revenue → check inventory availability.
- Returning customer activity falls → investigate retention and customer segments.
- Refunds rise → identify which products or orders contributed most.
This is an exception-based reporting workflow. Your dashboard tells you where something changed. Your deeper analytics tells you what deserves investigation. That is much more efficient than opening every report every morning.
Create a “Decision Test” for Every Metric
When deciding whether a metric belongs on your dashboard, ask three questions:
- What business question does this number answer?
- What would make me investigate it?
- What decision could I make if it changed?
If you cannot answer those questions, the metric may be informational rather than operational. There is nothing wrong with informational metrics. They just do not all deserve equal visibility.
Do Not Optimize Every Number at Once
This is where many dashboards go wrong.
- Revenue should increase.
- AOV should increase.
- Retention should increase.
- Refunds should decrease.
- Stockouts should decrease.
- Conversion should increase.
Taken individually, these goals sound reasonable. But business metrics interact. A major discount may increase conversion while lowering AOV. Reducing inventory may improve cash efficiency but increase stockout risk.
A high-value acquisition campaign may initially raise costs but produce stronger repeat customers later. Your job is not to push every dashboard arrow in the “good” direction at the same time. It is to understand the trade-offs behind the numbers.
A Simple Weekly Metric Review
A practical weekly review can remain surprisingly small. Start with your store-level outcomes:
- Revenue
- Orders
- Customer activity
Look for meaningful changes. If something moved, open the related drivers.
- Revenue changed? Review orders and AOV.
- Customer activity changed? Separate new and returning buyers.
- Product performance changed? Check stock availability.
- Inventory warning appeared? Compare remaining stock with demand.
- Refunds increased? Find where they came from.
Only continue digging while each step is helping answer the original question. Your reporting session should end with a conclusion not a screenshot of twenty metrics.
The Numbers That Matter Change With the Question
There is no universal list of ecommerce metrics that every merchant needs to watch with equal attention. The right metrics depend on the decision in front of you.
- Revenue matters when you want the overall commercial result.
- Orders matter when you need transaction volume.
- AOV matters when spending per purchase changes.
- Retention matters when you want to understand whether customers come back.
- Product revenue matters when deciding which items drive the business.
- Inventory matters when availability could affect future sales.
- Refunds matter when completed revenue is being reversed.
The mistake is not tracking the wrong metric. The mistake is tracking a metric without knowing what you want it to tell you. That is the difference between having ecommerce data and actually using it.
Statty AI is built around that idea: bring the important parts of store performance together, make meaningful changes easier to see and help merchants spend less time sorting through disconnected reports.
Because your store probably does not need more numbers. It needs a clearer answer to the question: What deserves my attention right now?