Start by Defining What “Retention” Means for Your Store
Before measuring retention, decide what behavior actually counts as successful retention.
For a coffee store, a second purchase within 30 or 60 days may be meaningful.
For skincare, the normal repurchase window could depend on how long a product lasts.
For furniture, expecting another purchase within one month would make little sense.
The same customer behavior can therefore look healthy in one business and weak in another. Do not begin with an arbitrary rule such as:
A customer who does not reorder within 90 days is lost.
Begin with the natural buying cycle of the products you sell. If customers normally repurchase every six weeks, a customer who has been inactive for five months deserves attention. If customers normally purchase once per year, the same five-month gap may be completely normal. This purchase-cycle context should sit behind every retention metric you review.
Returning Customer Rate and Customer Retention Rate Are Different
These two terms are easy to confuse. Shopify defines returning customer rate as the percentage of customers placing orders who are returning customers. In other words, it compares returning purchasers with all customers who placed orders in the measured period. That metric helps answer:
What share of the customers purchasing during this period have bought from us before?
Customer retention rate in Shopify's cohort reporting answers a different question. It measures the percentage of customers in a specific acquisition cohort who place another order during a later cohort period. A simple way to think about the difference is:
Metric | Main question |
Returning customer rate | How much current purchasing comes from previous customers? |
Cohort retention rate | How many customers from a particular acquisition group came back later? |
Returning customer count | How many previous customers purchased again? |
None of these is automatically the “best” retention metric. They answer different questions.
Why Returning Customer Rate Can Be Misleading
Imagine your store normally has: 500 returning customers and 500 new customers purchasing in a month. Returning customer rate is 50%. The next month, a successful acquisition campaign brings 1,000 new customers while the same 500 returning customers still purchase. Your returning customer count did not decline. But the returning customer rate falls to about 33%.
If you look only at the percentage, you might conclude retention became significantly worse. In reality, acquisition increased while returning activity stayed stable. This is why retention should never be judged from a single percentage. Whenever returning customer rate changes, also check the actual number of returning customers and the amount of revenue they generated. For a wider view of customer behavior, see our Shopify customer analytics guide.
Cohort Analysis Gives Retention a Fairer Time Frame
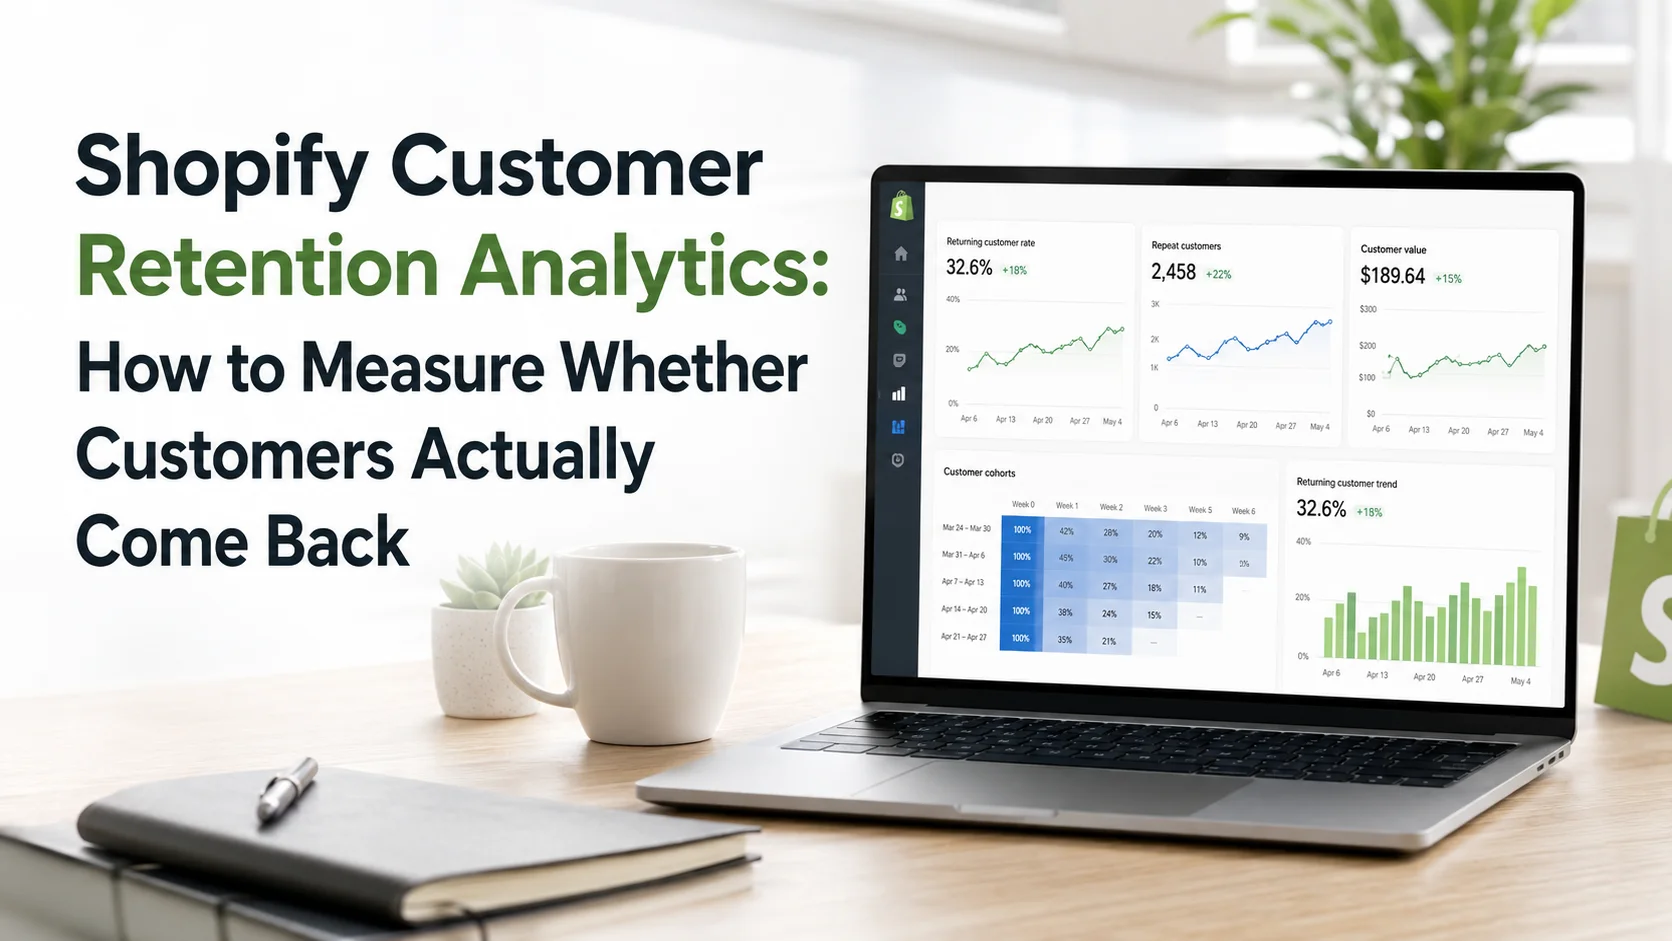
Cohort analysis is one of the most useful ways to measure customer retention because it compares customers who began their relationship with the store at a similar time. Shopify's Customer cohort analysis groups customers according to when they placed their first order. You can then track repeat purchasing across later weeks, months or quarters.
The report can display metrics such as customer retention rate, customer count, gross sales, net sales and average order value. Imagine 1,000 customers made their first purchase in January. You could review how many returned in:
Month 1
Month 2
Month 3
Month 4
Then compare that January cohort with customers first acquired in February or March. Now you are no longer mixing customers who have had twelve months to repurchase with customers who joined the store two weeks ago. That makes the comparison much more meaningful.
Understand Shopify's “Period 0” Before Reading the Cohort Report
This detail is easy to overlook. In Shopify's cohort analysis, Period 0 can include repeat orders made during the same period as the customer's first order. For example, if you use monthly cohorts and a customer makes their first purchase and another purchase during that same month, the repeat order can appear in Month 0.
That means Month 0 is not necessarily a traditional “after one month” retention measurement. Suppose a customer places their first order on January 2 and another on January 20. Both occurred during the January cohort period. If you want to understand retention after customers have had a full month to return, pay attention to Month 1 and later rather than treating Month 0 as equivalent. Understanding this small reporting detail can prevent incorrect conclusions.
Compare Cohorts at the Same Age
Another common mistake is comparing customer cohorts that have had different amounts of time to develop. Suppose your January cohort has six months of history but your May cohort has only two. You cannot fairly compare their Month 6 performance because the May cohort has not reached Month 6 yet. Instead, compare:
January Month 1 versus February Month 1.
January Month 2 versus February Month 2.
January Month 3 versus February Month 3.
This is called comparing cohorts at the same age. It lets you answer a much better question:
Are newer customers returning more successfully than customers we acquired before?
That is far more useful than simply asking whether your overall repeat-customer total increased.
Retention Percentage Is Only Half the Story
A high retention rate sounds positive, but you also need to understand the financial value of that retention. Imagine two customer cohorts.
Cohort A has a 30% Month 3 retention rate.
Cohort B has a 25% Month 3 retention rate.
At first, Cohort A appears stronger. But what if returning customers from Cohort B spend significantly more per customer? Now the answer becomes less obvious. Shopify's cohort analysis can show additional information including average order value, amount spent per customer, sales and total orders for each cohort interval. This helps you move from:
Are customers returning? To: Are valuable customers returning?
That distinction matters because retaining customers who make very small purchases may have a different financial effect from retaining customers who continue generating meaningful revenue.
Measure the Second Purchase Carefully
For many ecommerce businesses, the transition from first order to second order is one of the most important moments in the customer lifecycle. A first purchase proves that you acquired a customer. A second purchase provides evidence that the relationship continued.
Instead of focusing only on total repeat customers, examine how successfully new customers move toward their next purchase.
Ask: What percentage of customers acquired in a particular month purchased again?
Then ask: How long did it normally take?
The timing matters. If most repeat customers normally order again within 45 days, you have a useful behavioral benchmark. A new cohort reaching Day 60 with significantly fewer repeat purchases than usual may deserve investigation. This is much more actionable than looking at lifetime order counts without considering time.
Find the Point Where Retention Drops
Retention curves rarely stay flat. They usually decline as time passes because fewer customers continue purchasing in each later period. The useful question is where the decline becomes unusually steep.
Shopify's cohort reporting supports both a cohort-grid heatmap and a retention-curve visualization, which can help merchants compare how customer groups behave over time. Suppose retention looks healthy through Month 2 but falls sharply in Month 3. That creates a useful investigation point.
What normally happens around that stage?
Does the average product need replenishment before then?
Does post-purchase communication stop?
Do subscriptions behave differently from one-time purchases?
Do specific acquisition channels show stronger Month 3 retention?
You are no longer trying to “improve retention” as a vague objective. You are investigating a specific stage of the customer relationship.
Break Retention Down by First Purchase
One of the most valuable parts of Shopify's cohort analysis is the ability to filter cohorts according to characteristics of the customer's first order. Shopify currently supports first-order cohort filters including sales channel, marketing channel, marketing type, product name and subscription status. This allows much more useful retention questions.
Instead of asking: What is our retention rate? you can ask: Which first-purchase products produce customers who return most often?
Or: Do customers acquired through one marketing channel retain better than customers from another?
Or: Do subscription customers behave differently from one-time purchasers?
This is where retention analytics begins influencing acquisition and merchandising decisions. A campaign that generates cheap first purchases may not be attractive if those customers rarely return. A product with modest first-order revenue may be strategically valuable if customers who begin with it regularly become repeat buyers.
Look at Retention by Marketing Channel
Acquisition reports often stop at conversion. A channel generated 300 customers. Another generated 200. The first channel appears stronger. Customer retention analytics allows you to ask what happened afterward.
Shopify's cohort details can show the marketing channels associated with customers in a cohort, while cohort definitions can also be filtered by marketing channel. Imagine Paid Social acquires twice as many customers as Organic Search.
After three months, however, customers acquired through Organic Search may show stronger repeat purchasing and higher amount spent per customer. That changes how you evaluate acquisition quality. The best acquisition source is not always the one that creates the cheapest first order. It may be the source that consistently creates customers who stay valuable.
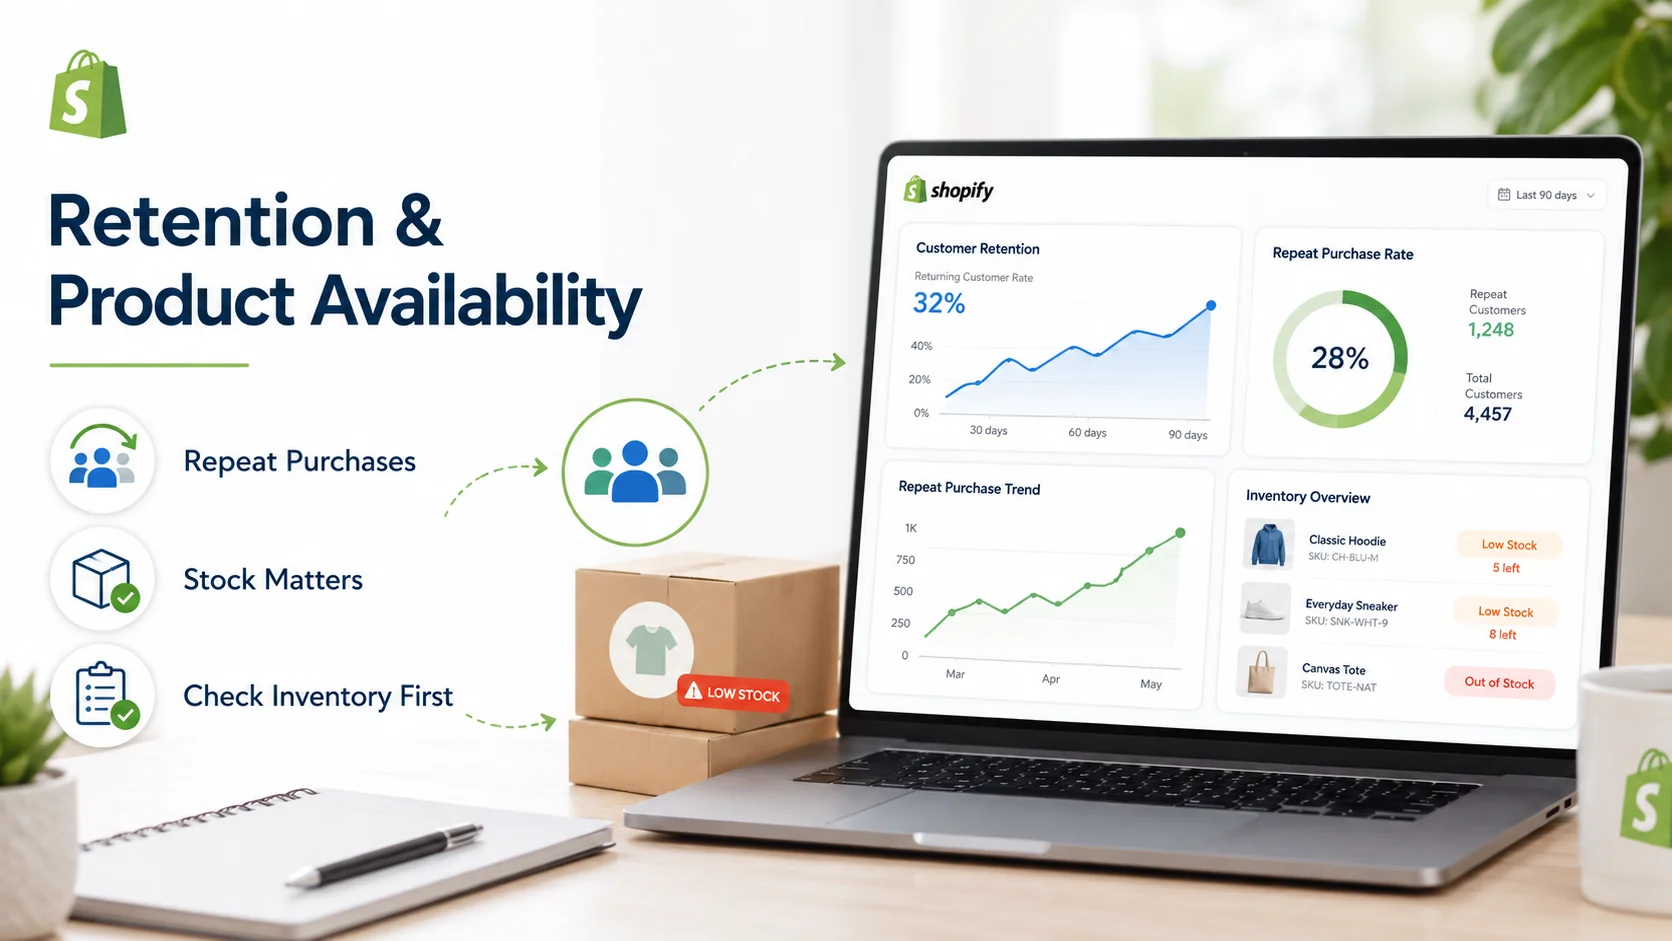
Connect Retention With Product Availability
Sometimes a retention problem is not actually a communication problem. Imagine customers normally repurchase a particular product every two months. Retention begins declining around Month 2. Before creating another email campaign, check product availability.
If that product has repeatedly been out of stock, customers may simply be unable to make their normal repeat purchase. This is why customer retention should not be analyzed separately from the rest of the business.
Products, inventory, fulfillment, customer experience and marketing can all affect whether somebody buys again. A connected Shopify analytics dashboard can make these relationships easier to investigate instead of forcing merchants to review customer retention in isolation.
Compare Retention by Customer Value
Not every retained customer contributes the same amount. One customer might return regularly but make small purchases. Another may return less frequently but generate much higher revenue. When evaluating retention, consider metrics such as:
Number of returning customers
Customer retention rate
Orders per customer
Average order value
Amount spent per customer
Net sales from the cohort
Shopify allows many of these metrics to be examined inside Customer cohort analysis. The goal is not to choose one metric and ignore the rest. It is to understand both how many customers return and what those returning relationships are worth.
Use Customer Segments After You Find the Retention Problem
Analytics identifies the pattern. Segmentation helps you act on it. Suppose cohort analysis shows that previously strong customers are becoming less active. You could then identify customers based on recency, frequency and spending behavior and create a more relevant retention audience.
Shopify's RFM reporting categorizes customers using recency, frequency and monetary value, including groups such as Loyal, At risk, Previously loyal and Champions. The important order is:
Measure first. Segment second. Act third.
Do not begin by creating dozens of customer segments and then search for a reason to use them. Start with a retention question and create the segment that helps address it. For more detail, read our guide to Shopify customer segmentation.
Do Not Measure Retention Too Frequently
Retention is usually not a real-time metric. A customer needs enough time to make another purchase before you can fairly evaluate whether they were retained.
Shopify also notes that most Customer reports may not display all customer activity from the previous 12 hours, although its New vs returning customers report is updated much more quickly. That makes retention better suited to weekly, monthly or cohort-based analysis depending on your store's purchase cycle.
Checking retention every hour will not create better decisions. For a product typically reordered every three months, monthly or quarterly cohort analysis may be more useful than daily monitoring. Let the buying cycle determine the reporting frequency.
A Practical Retention Example
Imagine a Shopify store sells consumable wellness products. Historically, customers who become repeat buyers usually place their second order within two months. The January cohort contained 1,000 new customers.
At Month 1, 180 purchased again. At Month 2, another 120 were active.
The February cohort also contained roughly 1,000 customers, but only 120 returned in Month 1 and 70 in Month 2. The February cohort is clearly retaining worse at the same stages. Now the merchant has a focused question:
What was different about customers acquired in February?
Further analysis shows that February relied much more heavily on a promotional campaign and a discounted introductory product. Instead of concluding that “customer retention is falling everywhere,” the merchant can investigate whether that campaign attracted customers with weaker repeat-purchase intent. That is the value of cohort-based measurement. It turns an overall retention problem into a specific business question.
Build a Monthly Customer Retention Review
A useful retention review does not need dozens of reports. Start by comparing the latest mature customer cohort with previous cohorts at the same age. Check whether retention improved or declined. Then look at the number of returning customers, not only the percentage.
Review amount spent per customer and average order value to understand whether retained customers remain financially valuable. If one cohort behaves unusually, break it down by first product, marketing channel or subscription status. Finally, decide whether the pattern requires action. Your review should end with a conclusion such as:
Customers acquired in May are returning less frequently by Month 2, primarily among customers whose first purchase came through Campaign A.
That is much more useful than: Our retention rate is 24%. One gives you a direction. The other gives you a number.
Measure Retention as a Relationship, Not a Score
There is no universal Shopify retention percentage that automatically tells you whether your store is healthy. Different products have different buying cycles. Different acquisition sources bring different customers. Subscription and one-time businesses behave differently.
Even customers within the same store can have completely different purchase patterns. Good Shopify customer retention analytics therefore focuses on consistency and comparison.
Measure similar customers over similar periods.
Compare cohorts at the same stage of their lifecycle.
Look at returning customer counts alongside rates.
Connect retention with revenue, products and acquisition sources.
Most importantly, investigate why one customer group behaves differently from another. Retention measurement becomes valuable when it stops being a percentage on a dashboard and starts helping you answer a business question:
Which customers are staying, which are leaving, and what can we learn from the difference?
Statty AI helps merchants connect customer intelligence with sales, products, inventory and other store data through an AI-powered Shopify analytics app.