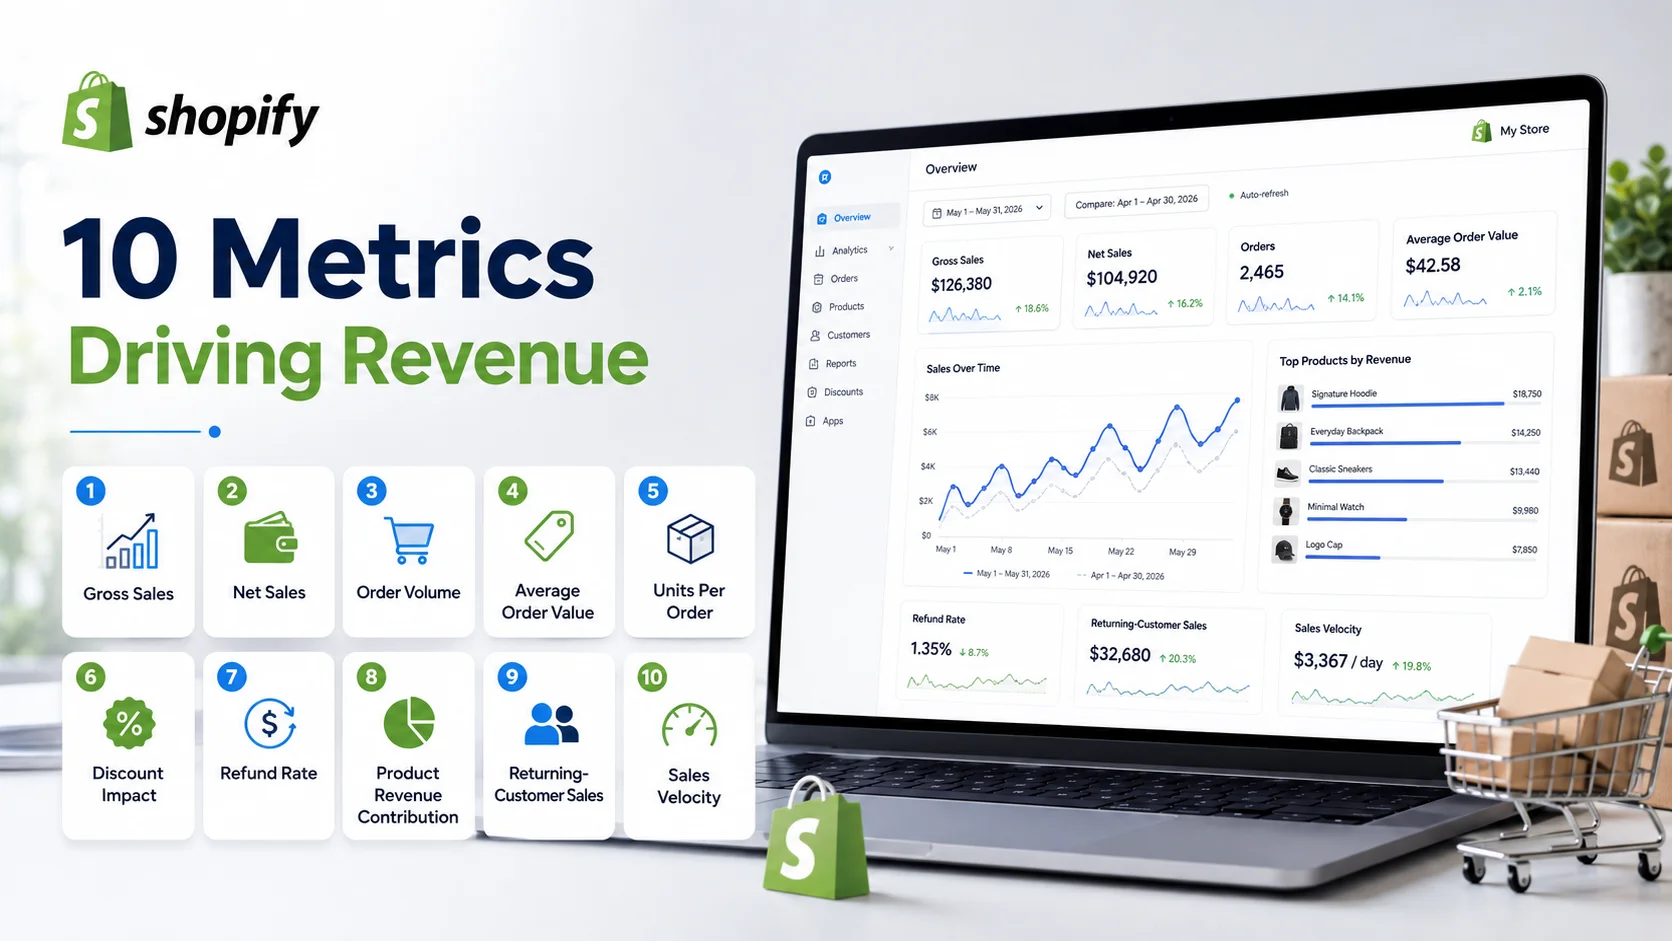
That is the real purpose of Shopify sales analytics. It helps merchants move beyond checking total revenue and understand the factors actually driving sales performance. The following metrics are especially useful because they help answer a different question about your store rather than simply adding another number to your dashboard.
1. Gross Sales: How Much Product Value Did You Sell?
Gross sales gives you a starting point for understanding demand before deductions such as discounts, refunds and returns are considered. This number can be useful when you want to see the total value of products customers originally purchased.
However, gross sales should never be treated as the final picture of store performance. A month with high gross sales may look impressive until you discover that heavy discounting or refunds significantly reduced the revenue the business actually kept. Think of gross sales as the top line of the sales story, not the conclusion.
2. Net Sales: How Much Revenue Did the Store Actually Retain?
Net sales gives you a more realistic view of sales performance because it reflects the effect of adjustments such as discounts and returns. This becomes important when comparing periods. Suppose gross sales increased by 15%, but net sales increased by only 5%. Something is reducing the value between the initial sale and the final result.
That might be heavier discounting, more refunds or a shift toward lower-value products. The important question is not simply: Did sales increase? It is: How much of that sales growth actually remained after adjustments? That distinction becomes increasingly important as a store grows.
3. Order Volume: Is Growth Coming From More Purchases?
Revenue tells you how much was sold. Order volume tells you how many transactions produced that revenue. Imagine sales increased by 20% while order count increased by 18%. That suggests the store generated substantially more purchases.
Now imagine sales increased by 20% but orders increased by only 2%. The explanation is probably different. Customers may have spent more per purchase or bought a more expensive product mix. Order volume helps separate transaction growth from spending growth. That makes it one of the first metrics worth checking whenever revenue changes unexpectedly.
4. Average Order Value: Are Customers Spending More Per Purchase?
Average order value helps explain how much revenue each order contributes on average. It is usually calculated as:
Revenue ÷ Number of orders
AOV becomes especially useful when order volume remains relatively stable but total sales move significantly. Suppose your store receives roughly the same number of orders this month as last month, but revenue falls. A lower AOV may explain the change. The next step is not automatically to increase prices.
First investigate why customers are spending less. Perhaps premium products were unavailable. Customers may be buying fewer items per transaction. A promotion may have shifted demand toward discounted products. AOV is therefore best treated as an investigative metric rather than simply something that must always increase.
5. Units Per Order: Are Customers Buying More Items or Just More Expensive Items?
Average order value tells you how much customers spend, but it does not tell you how many products they purchase. Units per order adds that context. Imagine AOV increases while units per order remains unchanged. Customers may simply be purchasing higher-priced products.
If both AOV and units per order increase, customers may be adding more items to their baskets. If units per order increases while AOV stays flat, customers may be purchasing more lower-priced products or receiving stronger discounts. This metric becomes useful when evaluating bundles, cross-sells, multi-buy offers and changes in product mix.
6. Discount Impact: Are Promotions Creating Real Growth?
Discounts can increase order activity, but higher order volume does not automatically mean the promotion created healthy sales growth. Suppose a campaign produces:
25% more orders
18% more gross sales
Much heavier discounting
Little improvement in net sales
The promotion successfully generated transactions, but the commercial impact may be less impressive than the order count suggests. Instead of evaluating a discount only by sales generated during the promotion, compare what changed in gross sales, net sales, order count and average order value.
You may discover that a smaller discount produces nearly the same demand while protecting more revenue per transaction. The point of sales analytics is not to prove that promotions work. It is to understand how they change buying behaviour and revenue quality.
7. Refund Rate: How Much Completed Revenue Comes Back?
Sales performance does not end when an order is completed. Some of that revenue may later be refunded. That is why refund activity deserves a place in Shopify sales analysis. A growing refund rate can weaken what otherwise looks like strong sales performance. More importantly, refunds become especially useful when broken down by product.
Imagine total refunds increased this month. That is a signal. Now imagine 60% of the increase came from one product. That is an actionable finding. The product may need a closer review of its description, quality, sizing, customer expectations or fulfilment experience. Sales analytics should help narrow the problem rather than leave you with a broad number.
8. Product Revenue Contribution: Which Products Actually Drive the Business?
A best-selling product is not always the product that matters most financially. One product may sell hundreds of inexpensive units while another sells fewer units but contributes significantly more revenue. That is why product performance should consider revenue contribution rather than only quantity sold. Ask questions such as:
What percentage of total sales comes from our top five products?
Is revenue becoming too dependent on one product?
Which products gained or lost the most revenue compared with the previous period?
This can reveal something important about risk. If one product contributes a large share of total store revenue, a stockout or sudden decline in demand could have a disproportionate effect on overall performance. Understanding revenue concentration helps merchants plan inventory, promotions and product development with more context.
9. Returning-Customer Sales: How Much Revenue Comes From Existing Buyers?
Customer numbers are useful, but revenue contribution tells you much more. Suppose new-customer orders increase while total revenue stays almost unchanged. At first, acquisition looks healthy. But if returning-customer revenue declined at the same time, new buyers may simply be replacing revenue that was previously coming from existing customers.
That creates a very different growth story. Tracking sales from new and returning customers helps merchants understand whether revenue is being built through acquisition, retention or a combination of both. For a broader understanding of how different store data connects, read our ecommerce data analytics guide.
10. Sales Velocity: How Quickly Is Demand Moving?
Sales velocity connects sales performance with time. Rather than simply asking how many units a product sold, ask how quickly those units are selling. This becomes particularly useful for inventory decisions. Imagine Product A and Product B each have 20 units remaining.
Product A sells two units per month.
Product B sells eight units per day.
The inventory quantity is identical, but the commercial risk is completely different. Sales velocity helps merchants identify where strong demand could soon turn into a stockout. This is why Shopify revenue analytics becomes more useful when product sales and inventory are viewed together. A product generating strong revenue today may become a revenue problem tomorrow if inventory cannot support current demand.
Do Not Judge Sales Metrics Individually
The most useful sales insights usually appear when several metrics are viewed together.
If revenue falls but orders remain stable, investigate AOV.
If AOV falls, review product mix, discounting and premium-product availability.
If gross sales rise but net sales remain weak, investigate discounts and refunds.
If product revenue falls, check whether demand declined or inventory was unavailable.
If new-customer revenue grows while returning revenue falls, growth may depend increasingly on acquisition.
This is where a connected Shopify analytics dashboard becomes useful. It allows related metrics to be reviewed together instead of treating every report as a separate result.
A Practical Sales Analysis Example
Imagine your Shopify store reports 12% revenue growth this month. At first glance, everything looks positive. A closer review shows that order count increased by 18%, while average order value declined by 5%. Discount usage also increased significantly during a promotional campaign.
At the same time, returning-customer revenue remained almost unchanged. The better interpretation is not simply: Sales grew by 12%. A more useful conclusion is: The store generated more transactions, largely during a promotion, but customers spent less per order and repeat-customer revenue did not meaningfully improve.
That information leads to better questions. Was the discount necessary to generate those orders? Did the campaign attract customers likely to return? Could the same order volume have been achieved with a smaller discount? The sales number opened the investigation. The supporting metrics made it useful.
Which Sales Metrics Should You Review Daily, Weekly and Monthly?
Not every sales metric needs the same review frequency. Daily monitoring is most useful for fast-moving signals such as revenue, order count, unusual refund activity and major product-sales changes. Weekly analysis is better for comparing average order value, product contribution, discount performance and recent sales trends.
Monthly reviews provide more context for customer revenue mix, sustained product-performance changes and whether sales growth is becoming stronger or more dependent on promotions. The goal is to avoid reacting to every daily movement while still identifying important issues quickly.
What Makes Shopify Sales Analytics Useful?
A useful sales report should answer more than: How much did we sell? It should help you understand:
Where did the revenue come from?
Did growth come from more orders or more spending?
Which products contributed most?
How much revenue was lost through discounts and refunds?
Are returning customers contributing more or less?
Could inventory problems affect future sales?
These questions turn Shopify sales data into information that can actually influence decisions. An AI-powered Shopify analytics app can also help merchants connect sales information with customer, product, inventory and checkout data instead of manually reviewing several separate reports.
Final Thoughts
The most important lesson in Shopify sales analytics is simple: revenue is the result, not the explanation. A merchant who only checks total sales knows whether the number moved. A merchant who also reviews orders, average order value, product contribution, discounts, refunds, customer revenue and sales velocity has a much better chance of understanding why it moved.
That difference matters because better explanations lead to better actions. Instead of reacting to a revenue decline with another promotion or reacting to growth by assuming everything is working, use your sales metrics to investigate what actually changed. That is when Shopify sales analytics becomes more than reporting. It becomes a practical tool for running the store.