First, Understand What Your Shopify Inventory Number Actually Means
Before analyzing inventory, it is important to understand that Shopify does not treat every unit in your location as immediately sellable.
Shopify currently separates inventory into states including On hand, Available, Committed, Unavailable, and Incoming. On-hand inventory includes units physically recorded at a location, while available inventory represents units that can currently be sold.
Committed inventory belongs to placed but unfulfilled orders; unavailable inventory may be reserved or held for reasons such as quality control; and incoming inventory is stock that has not yet been received.
That difference matters. Imagine Shopify shows 80 units on hand. It sounds like you can sell 80 units. But 20 may already be committed to orders and another 10 may be unavailable. The number you can actually sell is much smaller. When assessing stock risk, available inventory is often more useful than on-hand inventory alone.
Track Available Stock, Not Just Total Stock
A product can look well stocked while its sellable quantity is already becoming tight. This happens frequently when orders are waiting for fulfillment or some units have been reserved.
For day-to-day decisions, keep an eye on how many units are actually available to customers. If available stock is falling quickly, you may need to reorder even though the warehouse still contains a reasonable amount of physical inventory.
This is particularly important for high-volume products where committed orders can change quickly. Inventory analysis should therefore separate: What is physically present? From: What can still be sold? That distinction reduces the risk of reacting too late.
Sell-Through Rate Shows How Quickly Inventory Is Moving
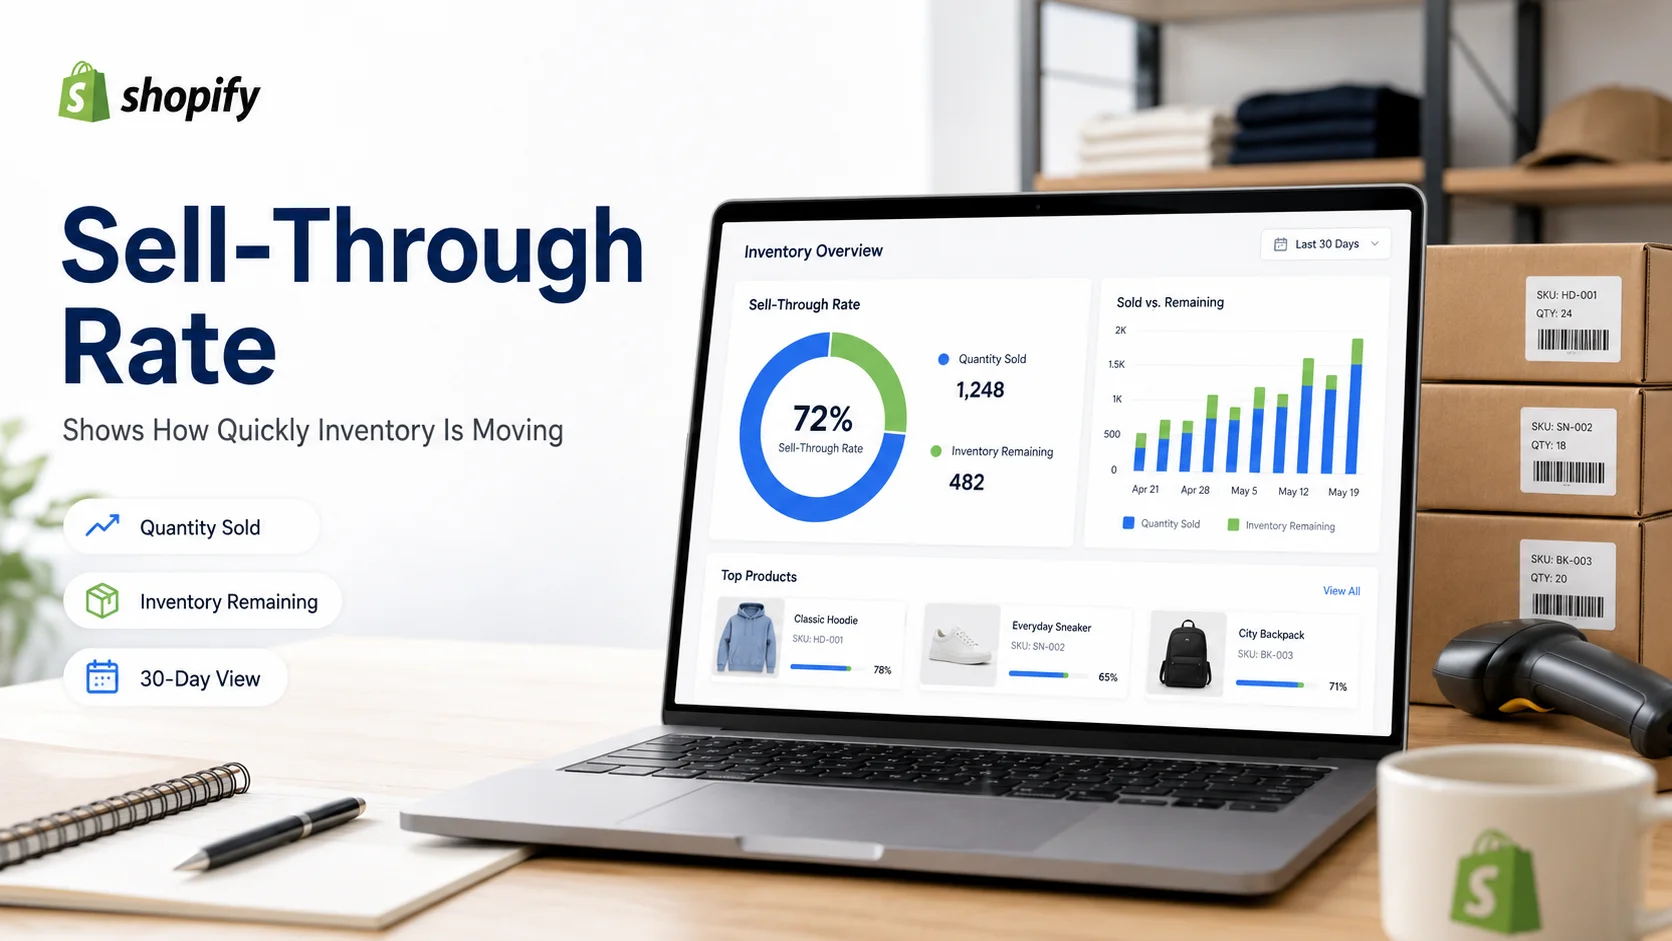
One of the most useful Shopify inventory metrics is sell-through rate. Shopify calculates product sell-through rate as the quantity sold divided by the quantity sold plus the inventory remaining. The product analytics bar uses the most recent 30-day period available, and Shopify notes that this data normally has around a two-day processing delay.
The metric helps answer: How much of the stock available during this period did customers actually buy?
A higher sell-through rate usually indicates stronger movement relative to available inventory. A lower rate may indicate slow-moving stock, but context still matters. A seasonal product might sell slowly today because its peak season has not arrived.
A newly launched product may not yet have enough history. A product could also appear to sell slowly because too much stock was purchased in the first place. Use sell-through rate as a signal, not an automatic reorder rule.
Days of Inventory Remaining Helps Answer “When Will We Run Out?”
Knowing that 40 units remain does not tell you whether you have four days or four months of stock. Days of inventory remaining adds sales velocity to the calculation. Shopify calculates this metric by dividing ending inventory quantity by the average quantity sold per day. Its current report uses recent sales activity, including a 28-day period for calculating average daily quantity sold.
Consider two products. Product A has 30 units remaining and sells one unit per day. Product B also has 30 units but sells ten per day. Their inventory count is identical. Their inventory risk is completely different.
This metric can therefore be much more useful for restocking than a simple low-stock threshold. But historical demand does not always predict future demand. Promotions, seasonality, new advertising or sudden trends can change sales velocity quickly. Use days remaining as an estimate rather than a guaranteed stockout date.
Compare Days Remaining With Supplier Lead Time
Days of inventory remaining becomes much more practical when you compare it with how long replenishment takes. Imagine your supplier normally needs 20 days to deliver stock. Your best-selling variant has only 12 estimated days of inventory remaining.
Even though the product has not reached zero, you already have a potential stockout problem. A simple decision rule is to compare: Expected days of stock remaining vs. expected replenishment time
If stock is likely to run out before replacement inventory can arrive, the product deserves attention. This is more useful than waiting until the quantity reaches an arbitrary number such as five units. A product selling once per month and a product selling twenty times per day should not share the same restocking logic.
Use ABC Analysis to Decide Which Stock Deserves the Most Attention
Not every product contributes equally to your business. Shopify's ABC inventory analysis categorizes products based on revenue contribution. Shopify currently describes A-grade products as roughly the products responsible for 80% of revenue, B-grade products for around 15%, and C-grade products for the remaining 5%.
This gives inventory decisions another layer. An A-grade product approaching stockout usually deserves more attention than a C-grade product with the same remaining quantity. At the same time, excessive C-grade inventory may tie up money and storage space without producing much sales value. ABC analysis can therefore support two different decisions:
Protect high-impact inventory.
Avoid unnecessary stockouts among products responsible for a large share of revenue.Reduce weak inventory exposure.
Be cautious about repeatedly overstocking products that contribute little revenue.
There is one important limitation: Shopify notes that its ABC revenue calculation uses retail price and does not factor product cost into the grade. So an A-grade product is important from a sales-revenue perspective, but it is not automatically your most profitable product.
Watch for Slow-Moving Inventory Before It Becomes Dead Stock
Stockouts get attention because customers cannot buy the product. Overstock is quieter. A product can sit in inventory for months without creating an obvious warning, but that stock still ties up purchasing budget and storage capacity. Look for products with a combination of:
Large remaining inventory
Low sell-through
Low daily sales velocity
Weak revenue contribution
One slow week does not make an item dead stock. Look for persistent patterns. If inventory remains high while sales continue to move slowly across several relevant periods, you may need to reconsider future purchasing, promotion or whether the product deserves the same shelf space. The goal is not simply to keep every product fully stocked. It is to keep the right amount of the right products.
Track Stockouts as Lost Selling Opportunity
An out-of-stock product deserves more attention when it was selling well immediately before becoming unavailable. Suppose a product suddenly shows zero sales. That could mean demand disappeared. Or it could mean the product had no available inventory.
These are completely different situations. This is why sales and inventory data should be analyzed together. Before treating declining product sales as a marketing or demand problem, check whether the item was available to purchase throughout the period.
If one of your high-revenue products repeatedly reaches zero available stock, that pattern may indicate that replenishment decisions are not keeping pace with demand. Statty AI's current Shopify App Store listing includes low-stock and out-of-stock alerts, alongside product and sales analytics. For a broader look at how sales figures should be interpreted, read our Shopify sales analytics guide.
Incoming Inventory Should Not Be Treated as Sellable Inventory
Incoming inventory is useful because it tells you replenishment is on the way. But Shopify does not classify incoming stock as available until it has actually been received. That distinction is important when planning around tight stock. Imagine you have:
5 units available
100 units incoming
The inventory position looks comfortable if you mentally combine those numbers. But if the shipment does not arrive for another two weeks and current demand is five units per day, you still have a stockout risk. When evaluating incoming inventory, consider:
Expected arrival date
Available quantity today
Recent sales velocity
Supplier reliability
Any expected promotion or seasonal change
Incoming quantity reduces future risk only when the timing works.
Multi-Location Stores Need Location-Level Context
For merchants holding inventory across several locations, a store-wide quantity can also hide problems. One location may have excess stock while another is close to running out. Shopify tracks inventory states across individual locations and allows merchants to review quantities according to where products are stocked and fulfilled.
This can create opportunities to rebalance inventory before placing another purchase order. If one location has slow-moving stock and another location is selling the same product quickly, transferring inventory may make more sense than purchasing more units immediately. The correct decision depends on transfer costs, fulfillment rules and customer demand, but location-level visibility prevents the total store quantity from hiding local shortages.
Inventory Adjustments Can Reveal Operational Problems
Inventory does not change only because customers purchase products. Quantities may also change because of returns, damaged stock, manual corrections, transfers or other adjustments. Shopify provides inventory adjustment reporting to help merchants review inventory history and changes.
If the recorded quantity repeatedly differs from what should be available based on sales, examine the adjustment history. Frequent unexpected corrections may indicate operational problems such as inaccurate receiving, counting mistakes or damaged stock. Sales analytics cannot explain those issues because the inventory disappeared outside the normal sales process.
Be Careful With Historical Inventory Comparisons
Shopify currently notes that historical data for inventory-based report metrics goes back only to October 1, 2023. That matters if you are trying to perform long-range inventory analysis.
A merchant with several years of sales history may still have a shorter period available for some inventory-specific reporting. When comparing long-term trends, make sure the data exists for both periods before drawing conclusions. A missing historical inventory value is not the same as zero inventory.
Create an Inventory Review Around Decisions
A useful inventory review should leave you knowing what needs to happen next. Start with products contributing meaningful revenue. Check their available stock and estimated days remaining. Then compare those figures with replenishment lead times and incoming inventory.
Next, review slow-moving products to identify where too much inventory may be sitting without enough demand. Finally, investigate products that repeatedly move into low-stock or out-of-stock status. Your review should produce conclusions such as:
Product A has around nine days of inventory remaining, but replenishment normally takes three weeks. Reordering needs attention now. Or: Product B has high inventory but low sell-through and contributes little revenue, so another purchase order is not currently justified. Those statements are more useful than: We have 4,500 units in stock.
Track Relationships, Not Just Quantities
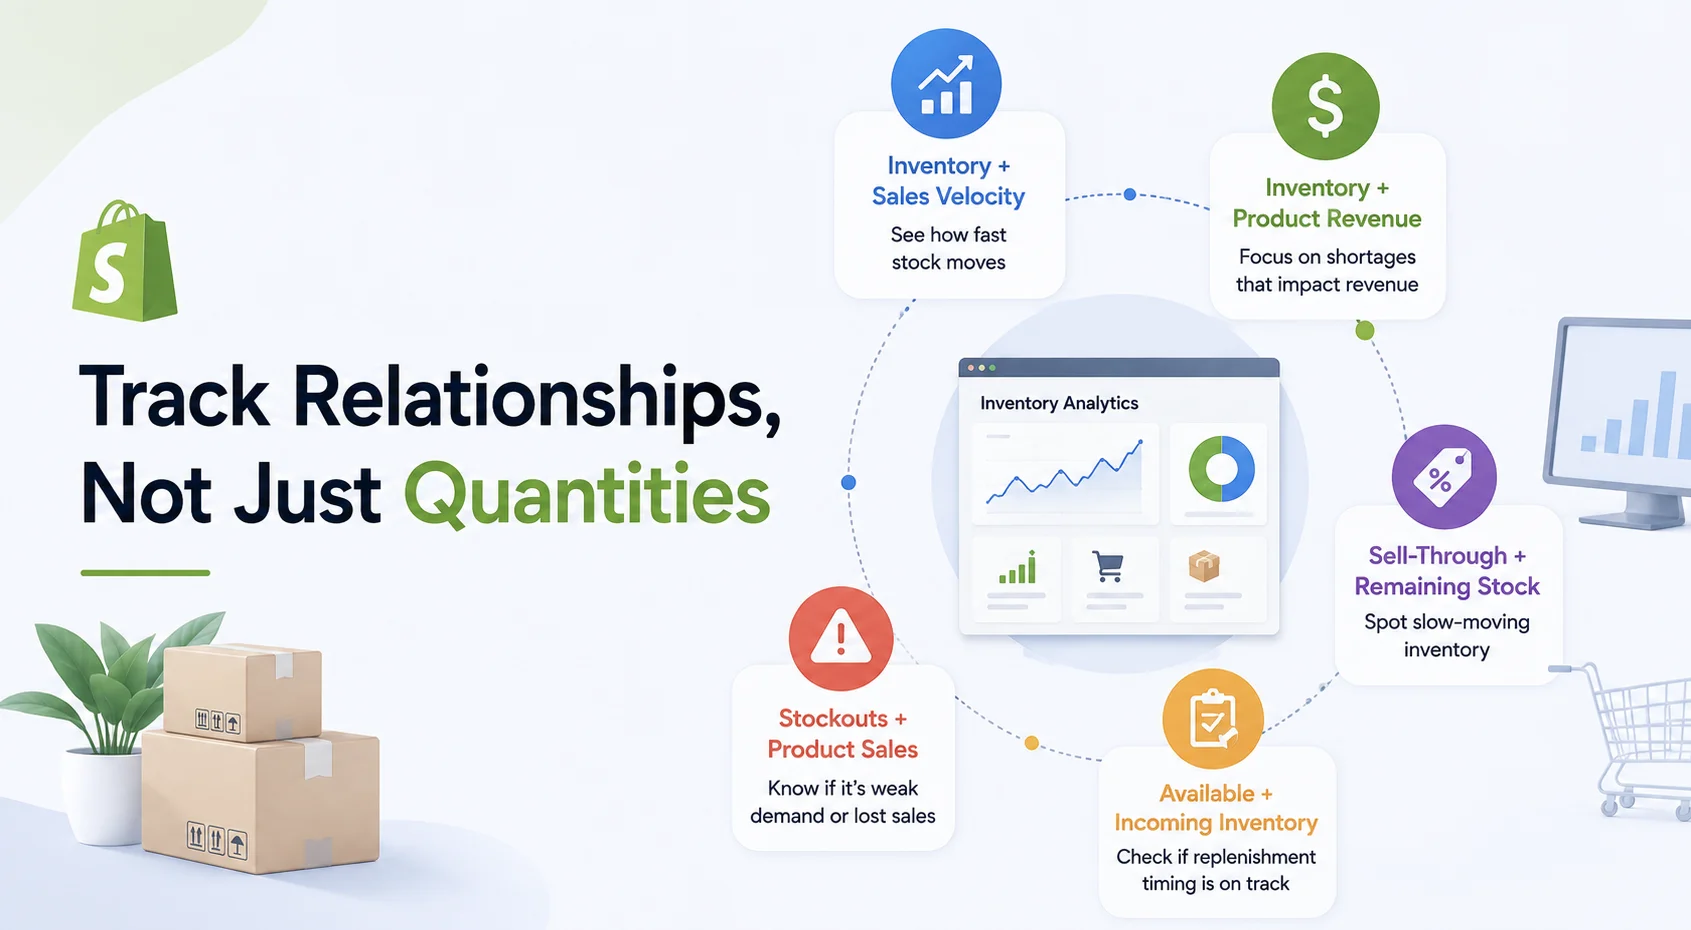
The strongest Shopify inventory analytics comes from connecting stock information with other store data.
Inventory + sales velocity tells you how quickly stock may run out.
Inventory + product revenue tells you which shortages could matter most.
Sell-through + remaining stock helps identify slow-moving inventory.
Available + incoming inventory helps show whether replenishment timing is adequate.
Stockouts + product sales helps distinguish weak demand from lost availability.
This is the same principle that makes broader ecommerce data analytics useful: individual numbers become more valuable when their relationship is understood.
Where a Shopify Inventory Dashboard Can Help
Shopify already provides inventory reporting, product analytics and inventory states that can support many stock decisions. A separate analytics application becomes useful when merchants want inventory signals connected more directly with sales, products, customers and other areas of store performance.
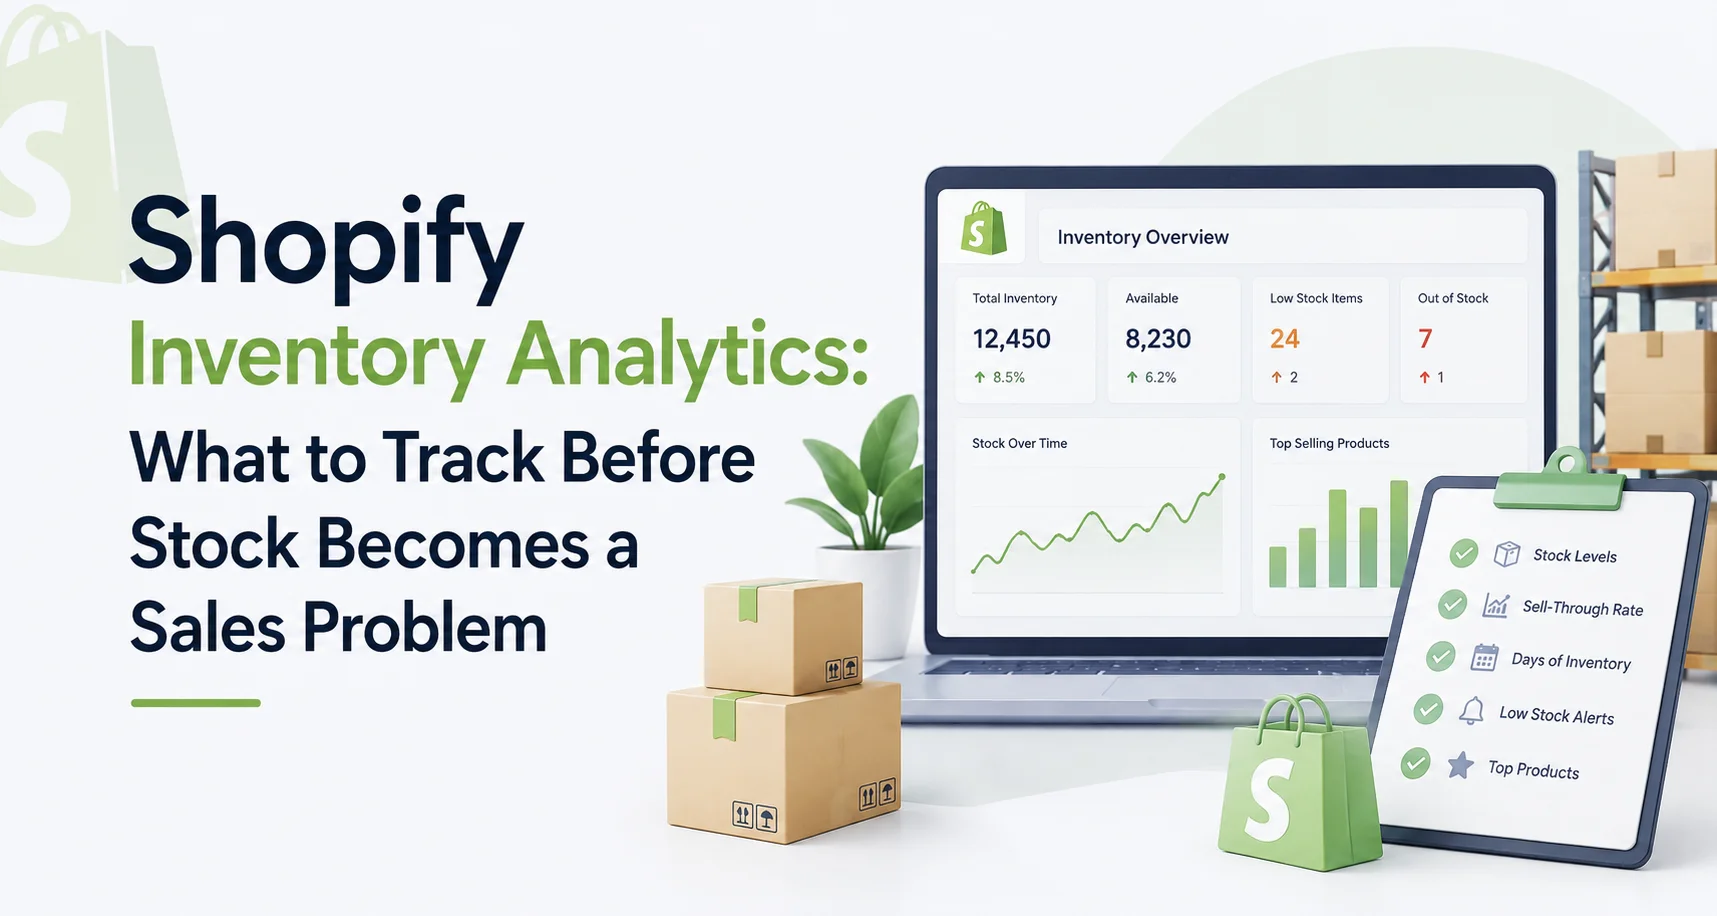
Statty AI brings product and inventory insights into its Shopify analytics dashboard, including low-stock and out-of-stock visibility alongside sales and product-performance information. Merchants who want those signals within a wider store-intelligence view can also explore Statty AI as an AI-powered Shopify analytics app.
Inventory Analytics Is Really About Timing
Inventory management often appears to be about quantity. In practice, the more important issue is timing.
Will the product remain available until replenishment arrives?
Is demand moving faster than expected?
Are you ordering another batch before existing inventory has proved it can sell?
Is valuable stock sitting in the wrong location?
Are high-revenue products receiving more attention than low-impact inventory?
The best inventory decisions come from combining quantity, demand, revenue contribution and time. Once you start analyzing those relationships, inventory stops being a static number in Shopify. It becomes a forward-looking signal about where sales could be protected, where cash may be tied up, and which products deserve attention before the problem becomes obvious.