So where should you actually start? The best way to track Shopify sales is to create a consistent reporting routine. Choose the sales number you use as your main reference, compare it across equivalent periods and only open deeper reports when you need to understand what caused a change.
Shopify currently provides a customizable Analytics dashboard as well as dedicated sales reports. Merchants can adjust date ranges, compare periods and open individual reports directly from dashboard metric cards. Shopify says dashboard and sales-report data is generally updated within about one minute.
First, Decide Which Sales Number You Are Tracking
One reason merchants become confused is that “sales” can refer to different calculations. Shopify defines gross sales as product price multiplied by quantity before discounts, taxes, shipping and sales reversals. Net sales factors in discounts and sales reversals, while total sales also includes items such as taxes, duties, shipping charges and additional fees. Shopify describes net sales as the preferred approximation of revenue for many analyses.
That means you should not switch between these figures depending on which dashboard happens to be open. If your goal is understanding product and revenue performance after discounts and reversals, net sales can provide a useful primary reference. If you need to understand the complete amount customers paid, total sales answers a different question.
Consistency matters more than choosing whichever number looks largest. Once you decide which metric you use for regular tracking, keep that definition consistent when comparing days, weeks and months.
Use the Analytics Dashboard for Your First Check
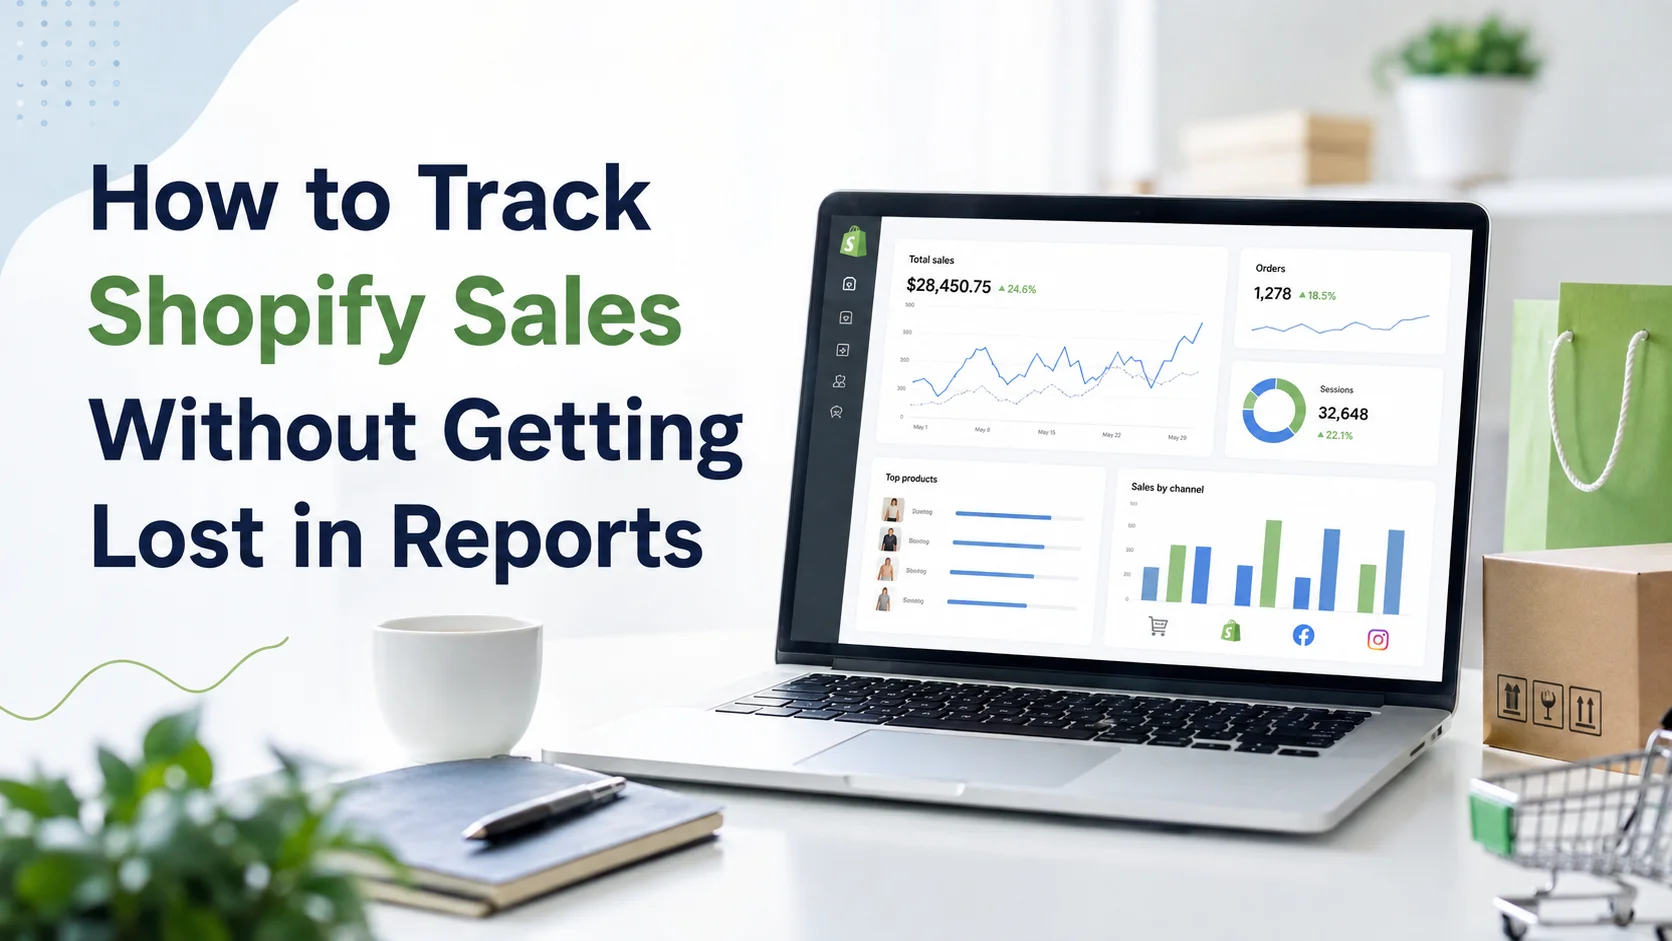
For a quick performance check, start in Shopify Admin → Analytics. The overview dashboard can display customizable metric cards and allows you to change the date range, compare performance with a previous period and open a deeper report by selecting an individual card.
Shopify also allows merchants to add, remove, resize and reorganize metric cards according to their workflow. Do not turn this dashboard into a wall of numbers. For sales tracking, your first view only needs enough information to tell you whether something changed.
A practical setup might keep your primary sales figure, orders and a small number of supporting metrics visible. The purpose of this screen is not to complete the analysis. It is to answer: Is anything different enough that I should investigate further If the answer is no, you may not need to open another report.
Open Sales Reports When You Need the Explanation
When the dashboard shows a meaningful change, move into Analytics → Reports and filter the reports by the Sales category. Shopify currently provides sales reporting by areas such as time, product, channel and customer, as well as average order value over time. Sales reports can also be customized with additional metrics and dimensions.
This is where tracking becomes more useful. Suppose your primary sales metric is down 9% compared with the previous week. Instead of staring at the percentage change, break the result down. Did the decline happen throughout the week or mainly on one day? Did one product lose a significant amount of sales? Did one sales channel weaken?
Were fewer orders placed, or did customers simply spend less? The overview tells you that sales changed. The deeper report helps you understand where the change came from. For more detail on interpreting sales performance itself, see our guide to Shopify sales analytics.
Compare Equivalent Time Periods
Sales tracking becomes misleading when the comparison itself is poor. A partial Monday should not be compared with an entire previous Monday. Seven days should not be compared directly with a full month. A Black Friday week should not automatically be judged against an ordinary week.
Shopify's Analytics dashboard supports comparisons against a previous period, previous year or a custom range. Its sales reports also support date-range comparisons. Choose the comparison based on the question you are asking.
If you are checking short-term movement, compare the latest seven completed days with the previous seven. If your business is seasonal, year-over-year comparisons may provide more useful context. If you are analyzing a promotion, compare it with a similar promotional period where possible. A percentage change is only meaningful when the periods behind it make sense.
Break Sales Down by Product Before Blaming Marketing
When sales decline, marketing often gets blamed first. But sometimes the problem is much closer to the product catalogue. Open your sales-by-product reporting and look at which products contributed most to the difference between the two periods.
Imagine total sales declined by $4,000. If one normally strong product accounts for $3,000 of that decline, you now have a much narrower investigation.
Was the product out of stock?
Did its price change?
Did a promotion end?
Did demand move toward another product?
Did it receive more returns?
This is much more useful than saying, “The store had a bad week.” Tracking sales by product lets you see whether a store-wide movement is actually being caused by a small number of items.
Check the Sales Channel When You Sell in More Than One Place
A Shopify merchant may sell through the online store, point of sale and other connected channels. Shopify sales reports can break sales down by sales channel, which makes it possible to see whether a change affected the whole business or one specific channel. Suppose total sales remain stable.
At first, nothing looks unusual. But after breaking them down by channel, you discover that online-store sales declined while another channel grew enough to hide the loss. The overall figure did not tell you that. This is why sales tracking should occasionally move below the store-wide total. A stable headline number can still contain meaningful changes underneath.
Do Not Confuse Sales With Payments Received
This distinction matters, particularly when reviewing finances. Shopify states that its sales reports track the value of goods sold rather than the movement of money between the merchant and customer. Depending on payment methods and timing, the amount shown as sales is not necessarily the amount already received in a payout.
Shopify directs merchants to finance/payment reports when they need to track payments and refunds as financial transactions. So if your question is: How much did we sell Use sales reporting. If your question is: How much money has actually been paid or settled? You are asking a finance question, not simply a sales question. Mixing these two can create unnecessary confusion when reconciling reports.
Pay Attention to Returns and Order Changes
Sales data can change after the original purchase. Shopify records sales as positive values on the date they occur and reversals as negative values when they are processed. Its reports can include activity from open, archived, pending and canceled orders, while test and deleted orders are excluded.
This means historical sales figures are not always frozen forever. A refund or return processed today may change what your reports tell you about the commercial result of an earlier order. That is another reason to avoid copying yesterday's number into a spreadsheet and assuming it can never change. For important monthly or accounting reviews, revisit the completed period after returns and adjustments have had time to appear.
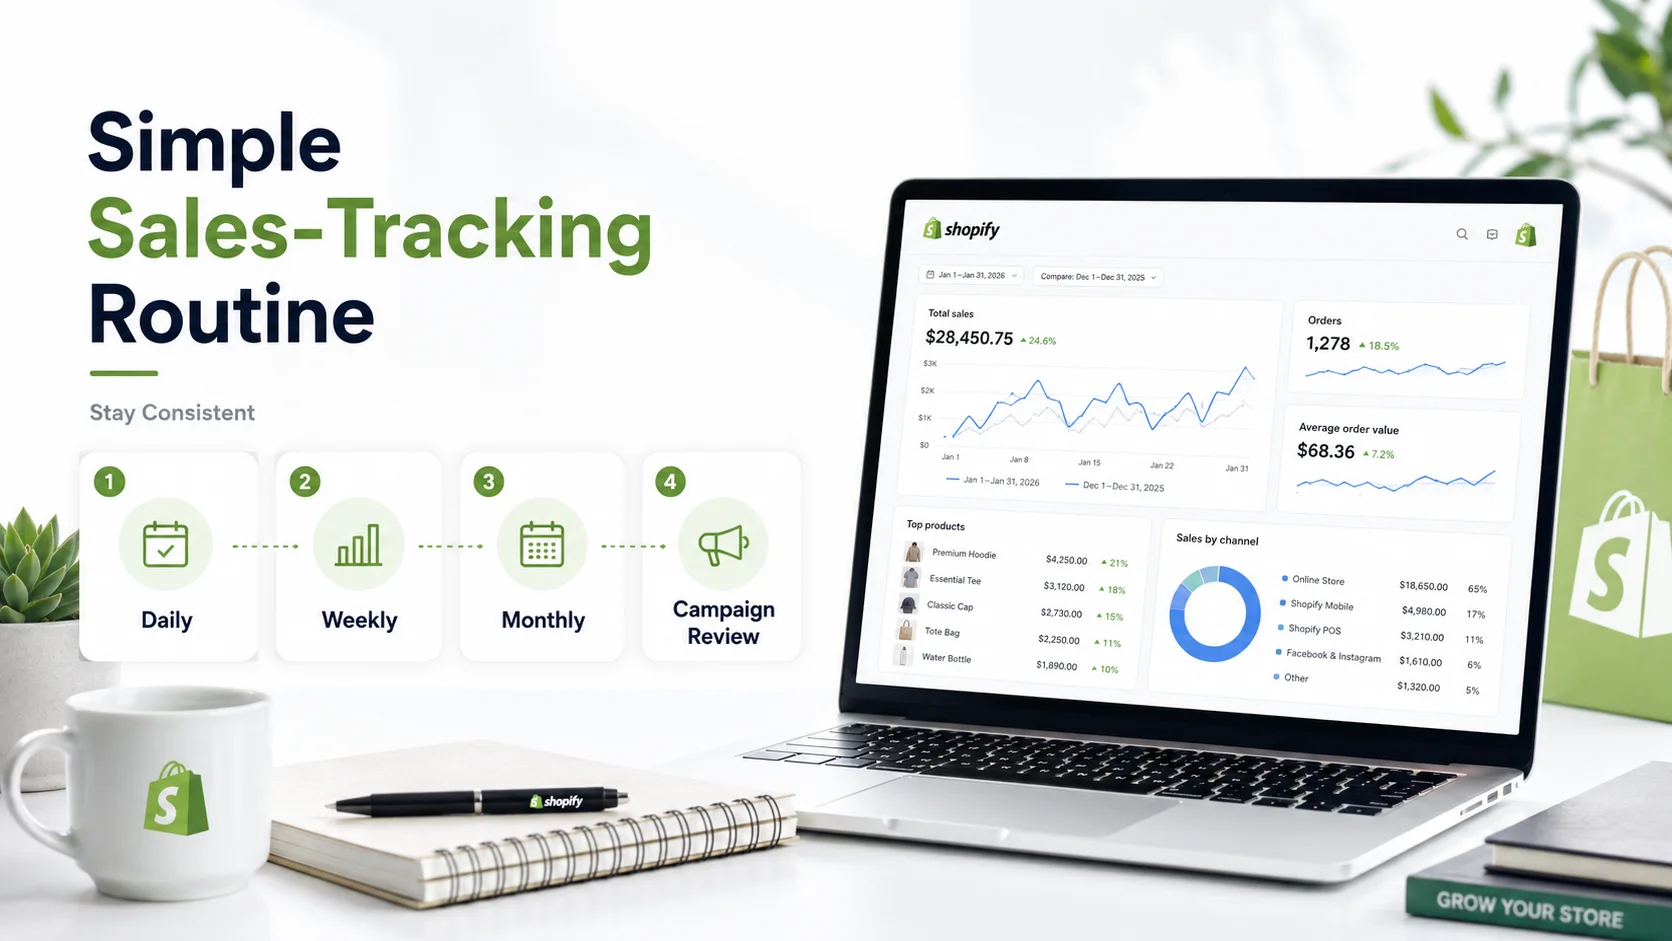
Create a Simple Sales-Tracking Routine
You do not need to perform a full analysis every morning. A better system is to review sales at different levels of depth.
Daily: Check whether sales and orders are moving within a normal range and look for unusually large changes that require immediate attention.
Weekly: Compare the latest completed week with an appropriate previous period. Investigate meaningful changes by product, channel or order behaviour.
Monthly: Review broader trends, product contribution, customer mix and whether repeated weekly changes are becoming a longer-term pattern.
Campaign or promotion review: Use a dedicated comparison period and separate the effect of the campaign from normal store performance.
The important part is consistency. If you change your metrics, date ranges and interpretation method every time you check sales, it becomes difficult to identify genuine trends.
Set Targets When a Number Needs a Goal
Tracking tells you what happened. A target tells you what you were trying to achieve. Shopify currently allows merchants to create targets for selected metrics and add those targets to the Analytics dashboard. A target can be useful when you have a specific commercial goal, such as reaching a monthly sales level.
But avoid setting targets for every metric just because the feature exists. A good target should influence a decision. If sales are behind target halfway through the month, you can investigate whether the gap comes from order volume, average order value, product availability or another factor. The target gives the analysis direction.
Export Reports Only When You Actually Need Them
Spreadsheets are useful, but merchants often create unnecessary manual reporting work by exporting Shopify data that could have been reviewed directly in the admin. Shopify currently supports report exports in formats including CSV, XML, JSONL and Parquet.
Export data when you need to perform further analysis, share it with another team or keep a particular reporting snapshot. Do not export simply because “weekly reporting” has always involved a spreadsheet. If the question can be answered directly inside Shopify, staying inside the reporting environment reduces duplicated work and the risk of analyzing an outdated file.
Why Shopify and Google Analytics Numbers May Differ
If you use Google Analytics alongside Shopify, do not expect every number to match exactly. Shopify documents several reasons for discrepancies between its analytics and third-party services such as Google Analytics, including differences in session definitions, cookies, JavaScript availability, tracking blockers and reporting time zones.
Use each platform for the job it does best. Shopify should remain central when you are reviewing store orders and Shopify sales activity. Google Analytics can add useful context around website traffic and user behaviour. If two systems disagree slightly, investigate the definitions and tracking method before assuming one is broken.
When a Separate Analytics Dashboard Becomes Useful
Shopify's native analytics can answer many sales questions directly. A separate application becomes useful when you want store data organized differently, need additional operational signals or want related areas connected in one view.
For example, sales may decline because of a product stockout, customer change or checkout problem. Looking only at sales requires you to move into other reports to investigate those relationships.
Statty AI brings sales together with customers, products, inventory, checkouts, refunds, store health and SEO in one Shopify analytics dashboard. Its current Shopify App Store listing also includes sales, customer and product analytics alongside abandoned-checkout monitoring, low-stock alerts and AI-powered insights.
Merchants who want that connected view can explore the AI-powered Shopify analytics app rather than relying on additional manual reporting. For a broader understanding of how different store information works together, read our ecommerce data analytics guide.
Track Sales to Answer Questions, Not Just Record Numbers
Good Shopify sales tracking should eventually help you answer something useful. Did sales change because there were more orders? Did one product create most of the movement? Did performance change only in one sales channel? Are adjustments or returns changing the final result? Is the latest week actually unusual, or does it fit your store's normal pattern?
Once you can answer those questions consistently, you no longer need to check every available report. You have a sales-tracking system. Start with one reliable sales measure, compare it consistently, investigate only meaningful changes and move into deeper reports when the headline number gives you a reason to look further. That is a much more useful way to track Shopify sales than simply refreshing the dashboard throughout the day.