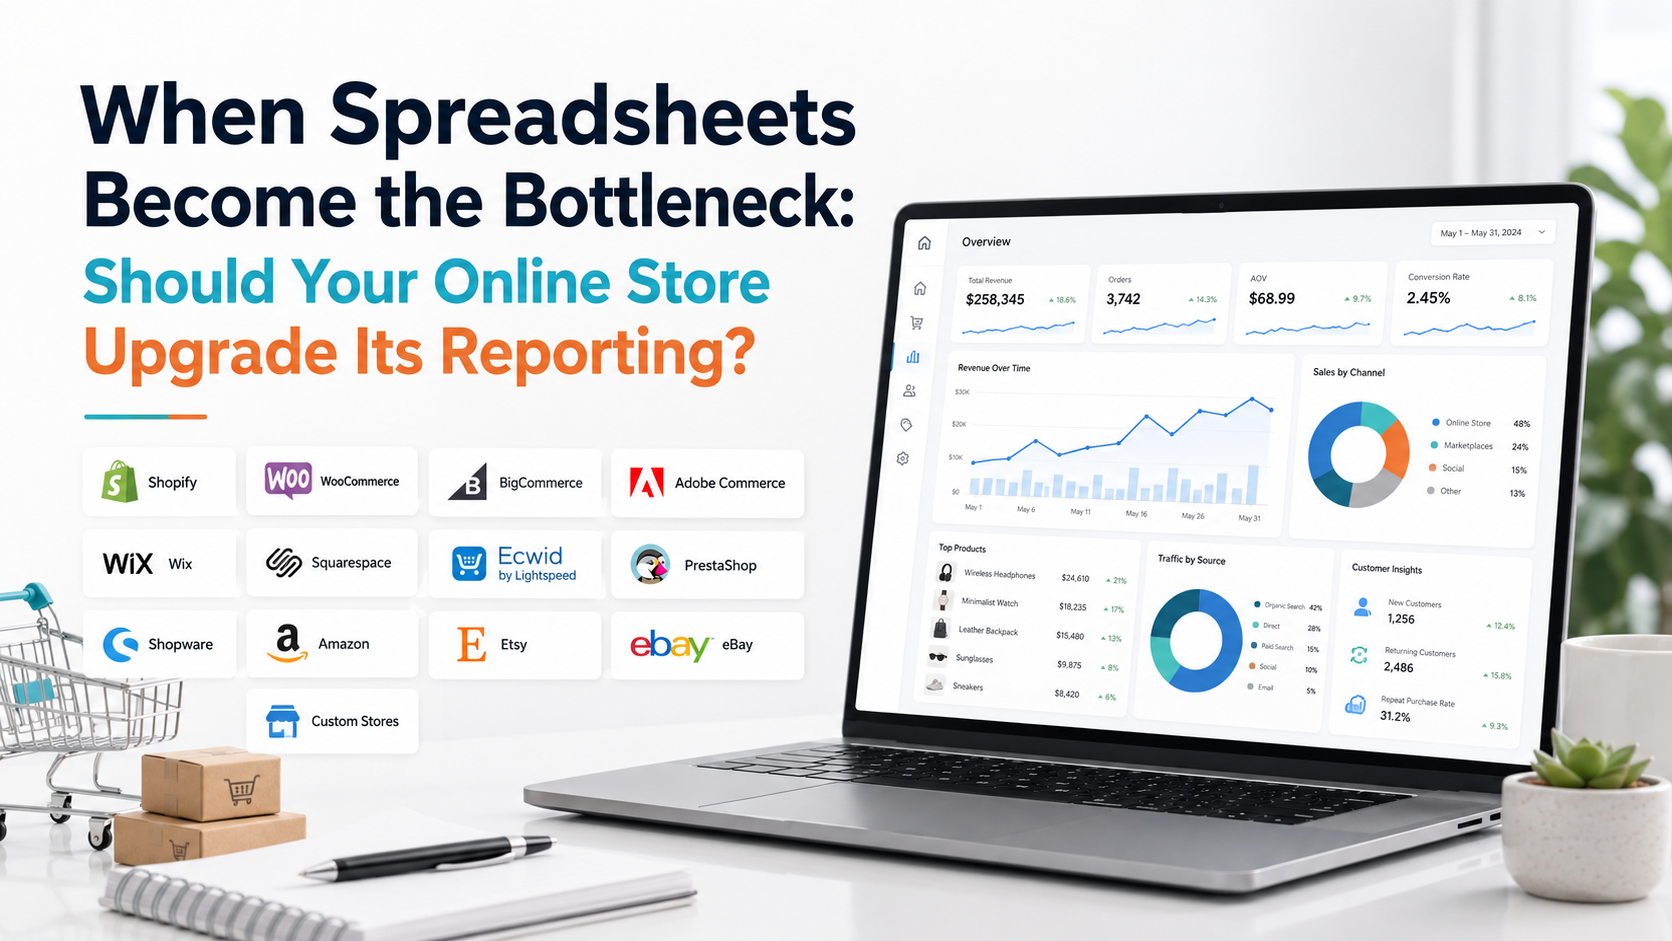
Spreadsheets are often where ecommerce reporting begins, and for good reason. You can export orders, paste advertising data into another tab, calculate average order value, build a pivot table and create a monthly performance report without purchasing another analytics system. For a small store, that may be exactly what you need.
The problem begins when Monday morning reporting looks like this: Download sales data. Export advertising reports. Copy inventory numbers. Update customer data. Fix columns that changed. Refresh formulas. Find out why revenue does not match the ecommerce platform. Send the file to somebody else. Discover that they are looking at last week's version.
At that point, the question is no longer whether spreadsheets can technically handle your data. The better question is whether manual reporting is still a sensible use of your team's time. That is where ecommerce reporting automation starts to become relevant.
You Do Not Need to Quit Spreadsheets Just Because Your Store Is Growing
There is no revenue threshold, order count or number of products at which every ecommerce business should stop using Excel or Google Sheets. A $5 million business with one simple sales channel might maintain a manageable spreadsheet workflow.
A much smaller business selling through several marketplaces, advertising platforms and fulfillment systems could already have a serious reporting problem. The decision depends more on reporting complexity than company size.
Ask how many systems feed your reports, how often the data needs updating, how much manual work is involved and how many decisions depend on the final numbers.
If one person can update a reliable weekly spreadsheet in fifteen minutes, there may be little reason to replace it. If three people spend half a day rebuilding the same report every Monday, the economics start looking very different.
The First Warning Sign: You Keep Rebuilding the Same Report
Spreadsheets are excellent for analysis. They become less attractive when the same manual preparation work has to be repeated continuously. Suppose every Monday you:
- Export orders from your store.
- Export traffic data.
- Download advertising results.
- Add refund information.
- Update inventory.
- Clean date formats.
- Match product names.
- Refresh pivot tables.
- Copy charts into another reporting file.
The analysis might take ten minutes. Preparing the analysis might take two hours. That distinction matters. If a process is repetitive, follows predictable rules and uses the same data sources each time, it is a strong candidate for automation.
Your analysts or store managers should ideally spend more time asking why something changed than copying the numbers required to discover that it changed.
Ask How Much Reporting Time Is Actually Data Preparation
One useful test is to measure your reporting workflow for a month. Do not estimate it. Track it. Separate the time into:
- Data collection: downloading and gathering information.
- Data preparation: cleaning columns, matching formats and fixing inconsistencies.
- Report maintenance: repairing formulas, updating ranges and correcting charts.
- Analysis: interpreting what actually happened.
If most of your reporting time falls into the first three categories, your spreadsheet may have become an operational bottleneck.
A reporting system creates more value when it reduces preparation work and leaves humans responsible for interpretation. This is also why the goal of ecommerce data analytics should be better decisions, not simply collecting more store data.
Manual CSV Exports Are Useful Until They Become the Workflow
CSV exports are not a bad reporting method. They are incredibly useful when you need a one-time analysis or want to inspect underlying records.
Shopify currently allows most reports to be exported in formats including CSV, XML, JSONL and Parquet. WooCommerce Analytics also allows report data to be downloaded as CSV for additional analysis.
The problem occurs when: Export → Download → Copy → Clean → Paste → Refresh becomes the permanent data pipeline for the business.
A CSV should often be the beginning of an investigation. It should not necessarily be the infrastructure supporting every recurring management report.
The Second Warning Sign: Nobody Is Completely Sure Which Number Is Correct
This is one of the strongest signs that manual reporting has become too complex. Imagine your ecommerce platform says revenue was $86,420. The management spreadsheet says $83,970. The marketing report says $89,200.
Now the weekly meeting begins with: Which number are we actually using? There can be legitimate reasons for differences. One report may use gross sales while another uses net sales.
Refund timing may differ. Taxes, shipping, cancelled orders, currencies or time zones may be treated differently. The problem is not simply that the numbers differ. The problem is when nobody can explain why they differ.
Once reporting depends on multiple spreadsheets with independent formulas and definitions, metric consistency becomes harder to maintain. A better reporting setup should establish clear definitions for important measures and apply them consistently.
The Third Warning Sign: Copy and Paste Has Become Business Critical
Manual input creates opportunities for ordinary mistakes. A row can be missed. A formula can be overwritten. A range can stop one column too early. One month's data can accidentally be pasted underneath the wrong heading.
A decimal can become text. A product identifier can be changed. None of these mistakes require incompetence. They are normal risks when people repeatedly manipulate data manually. If the spreadsheet is being used for a one-time calculation, correcting a mistake may be simple.
If executives, purchasing decisions, marketing budgets or inventory decisions depend on that workbook, the consequences become more serious. The more important the report becomes to the business, the less comfortable you should be with unnecessary manual dependencies.
The Fourth Warning Sign: Your Spreadsheet Is Now a Network of Spreadsheets
One file is manageable. Then Sales Report.xlsx needs information from Marketing.xlsx. Marketing.xlsx gets data from Ads.csv. Inventory.xlsx references Product Master.xlsx. Management Dashboard.xlsx pulls selected numbers from all of them.
Someone creates Management Dashboard FINAL.xlsx. Another person creates Management Dashboard FINAL V2.xlsx. Eventually the business does not have a report. It has a reporting ecosystem built from files.
That is usually a stronger reason to reconsider the setup than simply having a large spreadsheet. The problem is data lineage. If a number looks wrong, can you quickly determine:
- Where did it originate?
- Who changed it?
- Which transformation was applied?
- When was it last updated?
- Which other reports depend on it?
If answering those questions requires opening six files, reporting has become unnecessarily fragile.
Do Not Wait Until You Hit a Spreadsheet's Technical Limit
A store does not need to max out Excel before considering another reporting approach. Microsoft Excel supports up to 1,048,576 rows and 16,384 columns per worksheet, with other workbook and data-model limits depending partly on memory and system resources.
Those limits are useful to know, but hitting them should not be your migration strategy. A workbook can be operationally painful long before it reaches one million rows.
If opening the file is slow, calculations take too long, formulas become difficult to maintain or every update requires somebody with specialist knowledge of the workbook, you already have a practical scalability problem.
Performance is not only about whether the software can technically open the file. It is about whether people can still work with it efficiently.
Google Sheets Automation Can Also Reach Practical Limits
Google Sheets is convenient because it is collaborative and cloud based, and its import functions can automate parts of a reporting workflow. But connecting many sheets through functions such as IMPORTDATA, IMPORTXML or IMPORTRANGE does not automatically turn a spreadsheet into a robust data pipeline.
Google specifically warns that import functions can experience loading delays and throttling when spreadsheets generate too many requests or source data changes frequently. That does not mean you should avoid these functions.
It means you should recognize when a clever spreadsheet solution has gradually become infrastructure that the business now depends on. At that point, a purpose-built data connection or analytics layer may be easier to maintain.
The Fifth Warning Sign: Your Reports Are Already Outdated When They Are Finished
Suppose it takes two days to assemble a weekly report. By the time management receives it on Wednesday, some of the information reflects activity that ended on Sunday. For strategic reporting, that delay may be perfectly acceptable.
For inventory, checkout problems, advertising or sudden sales changes, it might not be. The question is: How quickly does this information need to influence a decision? If monthly management reporting is all you need, manual spreadsheets may remain practical.
If the store needs yesterday's inventory risk, today's checkout warning or frequently refreshed sales information, repeated manual exports become harder to justify. Modern BI tools can connect directly to underlying datasets instead of relying exclusively on manually uploaded files.
For example, Looker Studio supports connectors to sources including Google Analytics, Google Ads, Google Sheets, BigQuery, SQL databases and other systems, with many sources maintaining a live connection to the underlying data. Automating refreshes does not make the analysis smarter by itself. It simply means the analyst can begin with fresher information.
The Sixth Warning Sign: Reporting Breaks When One Person Is Away
Every business eventually develops "that spreadsheet." One person understands it completely.
- They know that column F cannot be moved.
- They know which tab needs refreshing first.
- They know why the revenue calculation excludes certain orders.
- They know that one formula breaks on the first Monday of the month.
Nobody else really understands the system. That is a key-person dependency. If the person is on holiday, changes roles or leaves the company, reporting suddenly becomes difficult.
A healthy reporting process should be understandable, documented and maintainable by more than one person. You do not need enterprise software to achieve that.
But if the spreadsheet has become so customized that its original creator is effectively required to operate it, the business has outgrown the process even if the file still works.
The Seventh Warning Sign: You Sell Through More Than One Channel
Multi-channel ecommerce is where spreadsheet complexity can accelerate quickly. Imagine a merchant sells through:
- A branded ecommerce website
- Amazon
- Etsy
- eBay
- Wholesale channels
Each environment may represent products, orders, fees, refunds, customers and dates differently. The reporting challenge becomes more than combining rows.
You may need to normalize currencies, product identifiers, channel names, order statuses and metric definitions. A product called SKU-124 in one platform may need to match a marketplace listing ID somewhere else.
A refund may appear differently across systems. One platform may provide customer-level information that another does not. You can solve these problems in spreadsheets. The question is whether you want to keep solving them manually every reporting cycle.
The Eighth Warning Sign: You Are Making Decisions From Stale Snapshots
Spreadsheets often contain a snapshot. That can be useful because the numbers stay fixed while you analyze them. But snapshots can become dangerous when people forget what they are looking at.
Suppose inventory.xlsx was exported Tuesday morning. On Thursday, someone uses it to decide whether a promotion can continue. The file still says 240 units are available. Actual inventory is now 58. The spreadsheet did not fail.
The business used a stale snapshot for a decision that required current information. A reporting process should match data freshness to decision speed. Not every metric needs constant updates.
Inventory availability may need frequent refreshes. Customer cohort analysis may not. Long-range planning certainly does not need minute-by-minute data. Automation is useful when the decision needs fresher information than the manual process reliably provides.
The Ninth Warning Sign: Adding a New Question Requires Rebuilding the Workbook
Good analytics should encourage questions.
- What happens if management asks:
- Which returning customers generated the most revenue last quarter?
- Which high-revenue products were out of stock during the sales decline?
- Which channel generated customers who came back again?
- Which products increased sales but also increased refunds?
If every new question requires importing another dataset, adding several tabs, writing VLOOKUP or XLOOKUP formulas and rebuilding the dashboard, your reporting architecture may be limiting analysis.
A connected analytics environment should make common dimensions such as products, customers, orders and dates reusable across different questions. That is one reason consistent data sources matter.
Looker Studio, for example, describes reusable data sources as a way to share a consistent data model across different reports. The objective is not avoiding formulas. It is avoiding repeated reconstruction of the same business logic.
The Tenth Warning Sign: Your Reporting Meeting Is Really a Reconciliation Meeting
A reporting meeting should discuss questions such as:
- Why did revenue change?
- Which products need attention?
- Are returning customers becoming less active?
- Which channels produced stronger customers?
Instead, some teams spend most of the meeting discussing:
- Why does Sarah's report say $94,000?
- Did you include cancelled orders?
- Is this before refunds?
- Which spreadsheet is current?
- Was Marketplace B included?
That is reporting debt. When people spend more time arguing about the preparation of a metric than interpreting the metric, the reporting process is consuming the attention it is supposed to support.
When Should You Actually Move Away From Spreadsheet-First Reporting?
There is no single trigger, but several warning signs appearing together usually create a strong case. Consider upgrading when:
- The same reports require repeated manual exports
- Data comes from several platforms
- Report preparation consumes more time than analysis
- Different files produce conflicting metric definitions
- Reports become stale before people act on them
- Formula errors are difficult to detect
- One person has become essential to keeping reporting running
- Multi-channel normalization is growing more complicated
- New questions require rebuilding the workbook
- Management regularly doubts which figures are correct
One warning sign may not justify changing anything. Five or six happening every week probably should.
Do You Need to Replace Spreadsheets Completely?
Usually not. This is where many "spreadsheet versus BI" arguments become unrealistic. Spreadsheets remain extremely useful after a business adopts automated reporting. Use spreadsheets for:
- Scenario modelling: What happens if conversion increases by 0.5 percentage points?
- Budget planning: How should next quarter's marketing budget be allocated?
- Forecast adjustments: What happens if supplier lead time increases?
- One-off investigations: I need to examine these 400 unusual orders.
- Financial modelling: Build calculations that are too specific for the standard dashboard.
- Data validation: Inspect a sample of raw records when something looks wrong.
The better transition is often: Stop using spreadsheets as the primary data pipeline. Keep using them as analytical tools. That is a very different decision.
What Should Replace the Manual Spreadsheet Process?
The answer depends on business complexity. A smaller store may only need the reporting already available inside its ecommerce platform. Another store may benefit from a connected dashboard pulling information from several systems. A larger operation may need a warehouse or database underneath a business-intelligence layer.
Microsoft, for example, supports moving Excel-based models into Power BI semantic models, where data can be refreshed and reused for reports rather than relying only on local workbook updates. The architecture does not need to be complicated simply because the business is growing. Choose the smallest reporting setup that solves the actual bottleneck.
Should a Small Store Buy Reporting Software?
Not automatically. Imagine a new store receives 80 orders per month. The owner exports one report each month, spends twenty minutes updating a simple spreadsheet and understands the numbers perfectly. Buying, integrating and learning a separate reporting platform may actually create more work.
Now imagine another small store has a website plus Amazon and Etsy, runs advertising across several channels and needs weekly product, customer and inventory analysis. That business may benefit from automation much earlier despite generating less revenue. Again, complexity matters more than size.
How Much Time Should Reporting Take Before Automation Is Worth It?
There is no universal number, but you can calculate the economics. Suppose two people each spend three hours per week preparing recurring reports.
That is six hours per week. Across roughly fifty working weeks, that is around 300 hours each year devoted largely to report preparation. Now ask:
- How much of that work could realistically be automated?
- How much does an alternative reporting system cost?
- How much implementation and maintenance will it require?
- Would faster reporting improve any important decisions?
The right comparison is not: Spreadsheet: free. Software: $X per month. The spreadsheet is not free if people spend hundreds of hours maintaining it.
At the same time, automation is not free either. Software requires setup, validation and ongoing governance. Compare total effort, not only subscription prices.
Automating a Bad Report Does Not Make It a Good Report
This is one of the most important things to fix before migrating. Do not automate twenty reports simply because the business has always produced them. Ask which ones people actually use. Your weekly ecommerce metrics may require frequent visibility.
A detailed annual product analysis probably does not. Before replacing spreadsheets, identify: Which decisions the reports support. Which metrics are actually needed. How each metric is defined.
Which source should be authoritative. How frequently each dataset should refresh. Who needs access. Which details belong in the dashboard and which should remain available for drill-down analysis. Otherwise you risk spending money to automate reporting clutter.
Clean Your Definitions Before You Connect Everything
Suppose one spreadsheet calculates revenue after refunds. Another calculates it before refunds. A third includes shipping. Connecting all three to an automated dashboard does not solve the disagreement.
It automates it. Before moving to a connected reporting system, standardize important definitions such as:
- Revenue
- Orders
- Customers
- Average order value
- Refunds
- Returns
- Available inventory
- Conversion
- Channel attribution
The same rule becomes more important when data comes from several ecommerce platforms. Automation magnifies whatever logic you give it. Make the logic trustworthy first.
Do Not Migrate Five Years of Data Just Because You Have It
Historical data can be valuable, especially for seasonality and customer analysis. But every migration does not need every CSV the company has ever created. Start with the history needed for actual reporting decisions.
You may need: 12 to 24 months for meaningful seasonality. Longer customer history for lifetime-value analysis. Only recent inventory data for operational alerts.
The correct depth depends on the question. Moving unnecessary historical files can increase setup work without improving the decisions the system supports.
Make the Transition in Stages
A reporting migration does not need to happen over one weekend. A practical sequence looks like this:
Stage 1: Document the Existing Report
Write down every input, formula, filter and metric definition that matters.
Stage 2: Identify the Most Repetitive Report
Start with one recurring report that requires significant manual work.
Stage 3: Connect or Automate the Source Data
Remove unnecessary export and copy-paste steps.
Stage 4: Rebuild the Metrics
Confirm that automated calculations match the definitions the business has agreed to use.
Stage 5: Run Both Systems Together
For several reporting cycles, compare the automated report with the existing spreadsheet. Investigate differences instead of assuming either system is correct.
Stage 6: Move the Spreadsheet Into a Supporting Role
Once the new process is reliable, use spreadsheets for ad hoc analysis and modelling rather than the recurring data pipeline. This reduces migration risk and lets the team build confidence gradually.
How Do You Know the New Reporting System Is Better?
Do not judge it by the number of dashboards. Measure the workflow. After moving away from spreadsheet-first reporting, you should ideally see improvements such as:
- Less manual preparation: Fewer repeated downloads and copy-paste steps.
- Faster availability: Reports are ready when decisions need to be made.
- Better consistency: Teams use agreed metric definitions.
- Easier investigation: Users can move from a store-level change into customers, products, inventory or other relevant details.
- Lower key-person dependency: Reporting does not stop because one workbook expert is unavailable.
- More analysis time: The team spends more time interpreting changes and less time assembling the data.
If none of those improve, changing tools has not necessarily improved reporting.
The Same Decision Applies Across Ecommerce Platforms
Spreadsheet reporting can appear at any stage of an ecommerce business, whether it operates through Shopify, WooCommerce, BigCommerce, Adobe Commerce, Wix, Squarespace, Ecwid, PrestaShop, Shopware, Amazon, Etsy, eBay or a custom ecommerce environment.
A Shopify store might export store reports into Excel. A WooCommerce merchant might download Analytics data as CSV. An Amazon or Etsy seller might combine marketplace reporting with advertising and inventory files.
A multi-platform retailer may need to reconcile all of these sources. The trigger for change is the same: Has manual reporting become harder to maintain than the business questions it is supposed to answer?
Where Statty AI Fits
Statty AI is designed to help ecommerce businesses move away from fragmented reporting by bringing important store signals into a clearer analytics environment.
Instead of repeatedly assembling sales, customers, products, inventory and other performance information manually, merchants can use connected analytics to spend more time understanding the business.
You can explore the Statty AI analytics features or visit Statty AI to learn more about its approach to ecommerce reporting and store intelligence.
For merchants deciding what the resulting reporting environment should actually contain, our guide on ecommerce analytics dashboards explains how to separate high-level signals from deeper analysis.
Final Thoughts
An online store should not stop using spreadsheets simply because spreadsheets are old technology. It should reconsider them when the spreadsheet has stopped being an analytical tool and started becoming reporting infrastructure.
If your team repeatedly exports the same data, fixes the same formulas, reconciles conflicting numbers, waits for one person to refresh reports and receives information after the moment to act has passed, reporting automation is worth evaluating.
But do not throw Excel or Google Sheets away. Use them for what they are exceptionally good at: flexible analysis, modelling, planning and one-off investigations.
Move the repetitive data collection, recurring metric calculations and shared dashboards into a system better designed for those jobs. The goal of ecommerce reporting automation is not to eliminate spreadsheets. It is to eliminate the manual work that prevents people from using the data well.