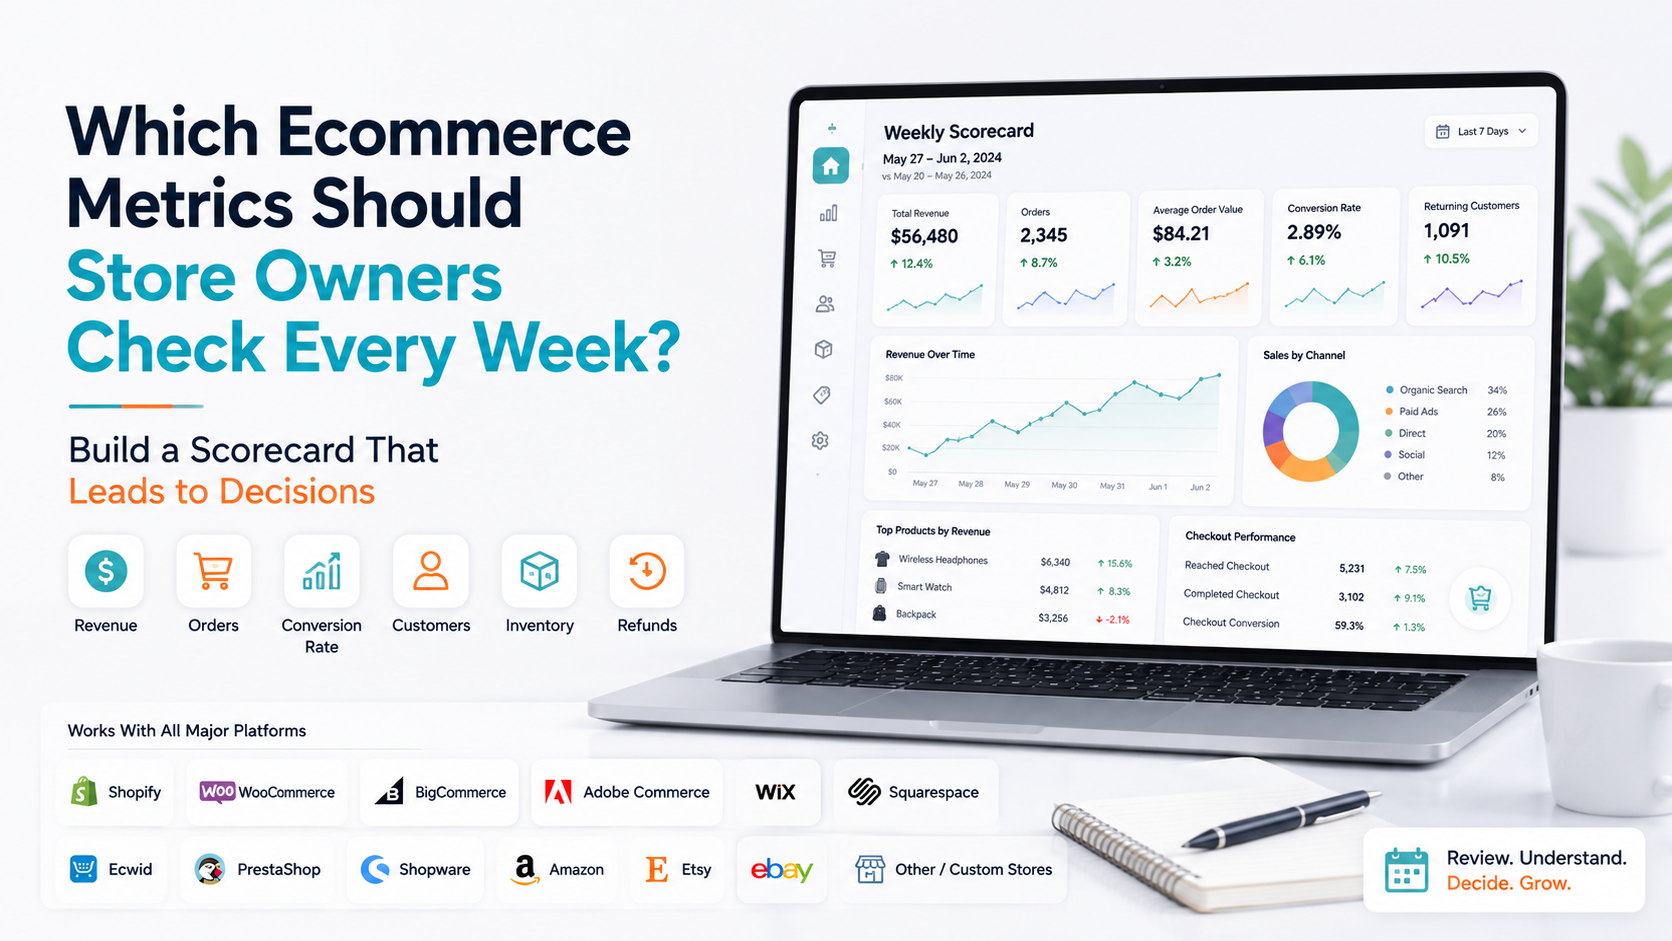
Most ecommerce stores do not have a data shortage. They have a review problem. Revenue appears in one dashboard. Website traffic sits somewhere else. Customer reports contain another set of numbers.
Product performance, inventory, checkout activity and refunds may each have their own reports. If you try to analyze all of that every week, reporting quickly becomes a job of its own.
A better approach is to create a small weekly ecommerce metrics scorecard that answers a few important questions:
- Did the store grow or decline?
- Did the number of purchases change?
- Are customers spending differently?
- Are we attracting and retaining the right customers?
- Which products affected performance?
- Is inventory creating risk?
- Are we losing more sales before or after checkout?
The goal of a weekly review is not to understand every detail of the business. It is to identify what changed enough to deserve your attention next.
Why Weekly Reviews Work Better Than Watching the Dashboard All Day
Some ecommerce numbers deserve daily monitoring. A sudden payment failure, stockout or 60% drop in orders should not wait until Friday. But deeper analysis usually benefits from a longer window.
Daily sales naturally fluctuate because of weekdays, weekends, campaigns, customer behavior and random variation. Looking at a full week gives those movements more context.
Shopify's current Analytics dashboard, for example, supports comparisons across date ranges and surfaces trends in areas including sales, orders, average order value, returning customer rate, sessions and conversion.
The exact reports will differ across Shopify, WooCommerce, BigCommerce, Adobe Commerce, Wix, marketplaces and other ecommerce systems, but the principle remains the same. Your weekly review should help you see the direction of the business, not make you react emotionally to every quiet afternoon.
Start With a Completed Week
Before checking the metrics themselves, make sure the comparison is fair. If you review Monday through Sunday, compare the latest completed Monday through Sunday with the previous completed Monday through Sunday. Do not compare seven complete days with five days of the current week.
For strongly seasonal businesses, it can also be useful to compare the same period with the previous year. A Christmas-week comparison against an ordinary November week will tell you very little. A good weekly scorecard should therefore show at least:
- Current completed weekPrevious comparable weekPercentage or absolute change
For important seasonal businesses, add the equivalent period from the previous year when enough historical data exists.
1. Revenue: Did the Commercial Result Actually Change?
Revenue is usually the first metric store owners want to see. That is reasonable, but your weekly review should treat revenue as the starting signal, not the entire analysis. Suppose revenue increased 13%.
Before celebrating, ask what created the increase. Did you receive more orders? Did customers spend more per purchase? Did one product have an unusually strong week? Was there a promotion?
Now imagine revenue falls 13%. The same rule applies. Do not assume marketing failed. The cause may sit in order volume, average order value, product availability, customer retention or checkout performance.
Your weekly scorecard should therefore show revenue alongside the metrics that explain it. For Shopify merchants who want a deeper sales-specific framework, see the Shopify Sales Analytics guide.
2. Orders: Did More or Fewer Purchases Happen?
Revenue and orders should almost always be reviewed together. Consider two weeks:
- Week A: Revenue +15%, Orders +14%Week B: Revenue +15%, Orders +1%
The revenue improvement is identical, but the businesses had very different weeks. Week A probably produced meaningfully more transactions. Week B generated roughly the same number of purchases but extracted more value from them.
If revenue falls and orders fall at roughly the same rate, purchase volume deserves investigation. If revenue falls but orders remain stable, average order value becomes more important. This simple relationship prevents you from immediately opening ten unrelated reports.
3. Average Order Value: Did Customers Spend Differently?
Average order value helps explain what happened inside each transaction. If your store had a normal number of orders but weaker revenue, AOV may reveal that customers spent less per purchase.
That does not automatically mean you need an upsell campaign. First investigate why spending changed. Possible explanations include:
- Customers buying fewer items
- Higher-value products contributing less
- Stronger discounting
- Premium variants being unavailable
- Product mix shifting toward lower-priced items
Shopify includes AOV among its core sales metrics and surfaces it alongside sales and order trends. The important weekly question is not simply: Is AOV higher or lower? It is: Does the AOV change help explain what happened to revenue?
4. Traffic or Store Visibility: Did Enough Potential Buyers Reach You?
If orders decline, you need to know whether the problem began before shoppers even reached your products. For a website-based ecommerce store, track qualified traffic or sessions.
For marketplaces such as Amazon, Etsy and eBay, the equivalent signal may be listing views, impressions, visits or another marketplace visibility metric. Do not judge traffic in isolation.
Suppose traffic increases 25%, but orders barely move. More people reached the store, but the additional traffic did not produce comparable purchasing activity.
Now suppose traffic falls 20% while conversion remains stable. The main issue may be acquisition or visibility rather than the buying experience. Your weekly review should therefore ask:
Did the store attract more or fewer potential buyers, and did purchasing activity move with them?
For website stores using Google Analytics, the Purchase journey report can show movement from session start through product view, add to cart, checkout and purchase.
5. Conversion or Purchase Completion: Did Visitors Actually Become Buyers?
Traffic tells you whether people arrived. Conversion tells you whether enough of them purchased. This is one of the most useful weekly ecommerce metrics, but it is also one of the most commonly oversimplified.
Do not become obsessed with finding a universal "good ecommerce conversion rate." Product price, traffic source, geography, device mix, purchase frequency, business model and customer intent can all change conversion behavior.
Your own historical baseline is usually much more useful. If your store normally converts within a relatively consistent range and suddenly falls well outside that range, investigate. If conversion has been gradually improving for three months, that trend matters more than whether it matches a benchmark from an unrelated store.
Where Did Conversion Change?
If conversion suddenly falls, move one level deeper rather than immediately redesigning the website. A purchase funnel can help you isolate the stage that changed:
- Product viewed
- Product added to cart
- Checkout started
- Purchase completed
Google Analytics currently uses these stages in its Purchase journey reporting and can show where users leave the funnel.
If product views remain stable but add-to-cart activity falls, investigate product pages, price, availability and offer quality.
If add-to-cart remains stable but fewer shoppers begin checkout, examine the cart experience.
If checkout starts remain normal but completed purchases fall, investigate payment, shipping, checkout errors and technical changes.
Your weekly scorecard should show the main conversion indicator. The deeper funnel belongs in the investigation that follows.
6. New vs Returning Customers: What Kind of Growth Are You Getting?
Total customer count can hide an important shift. Imagine customer purchases increased by 12%. That sounds healthy. But suppose all of the growth came from first-time customers while returning-customer activity declined.
The business may be improving acquisition while weakening retention. Now reverse it. Returning-customer activity increases while new customers fall. Existing relationships are helping sustain the business, but new customer acquisition may need attention.
Shopify's current customer reporting distinguishes first-time from returning customers and provides cohort analysis for studying repeat purchases over time. You do not need to perform a complete retention analysis every Friday.
For the weekly scorecard, track enough customer information to detect a shift in the balance between new business and repeat business. Then use cohort or retention reporting for deeper monthly analysis. The customer retention analytics guide explains that deeper process.
Should Customer Retention Be Checked Every Week?
Yes, but not necessarily as a full retention-rate analysis. True retention often requires enough time for customers to have a realistic opportunity to purchase again. A product typically reordered every three months should not be judged from seven days of behavior.
Weekly reviews are better for early customer signals:
- Returning-customer count
- Revenue from returning customers
- Major changes in repeat purchasing
- Previously strong customer groups becoming less active
Then perform proper cohort and retention analysis over longer periods. This keeps you from forcing a long-term customer metric into an unrealistic weekly window.
7. Top Product Contribution: What Actually Drove the Week?
Your store-level performance may be controlled by a surprisingly small part of the catalog. That is why every weekly review should include the products that contributed most to the change. Do not simply look at "top sellers."
Ask: Which products gained the most revenue compared with last week?
And: Which products lost the most?
Suppose total revenue falls by $8,000. You discover that one major product generated $6,000 less than usual. Your investigation has just become much more focused. Check whether that product:
- Had lower demand
- Was unavailable
- Lost an important variant
- Came off promotion
- Had a price change
- Generated more refunds
- Lost marketplace or advertising visibility
A store-wide result can sometimes have a product-level explanation.
8. Inventory Risk: Can Your Best Products Keep Selling?
Weekly inventory analysis should not mean checking the quantity of every SKU. Instead, look for inventory conditions that could affect future sales. Give the most attention to products that combine strong demand with limited remaining stock.
Shopify's product analytics currently includes sell-through rate and days of inventory remaining. Its inventory reports estimate days remaining using ending inventory and average daily quantity sold. That is much more useful than saying:
Product A has 20 units left.
Twenty units might represent three months of supply or one afternoon of demand. A useful weekly inventory review asks:
Which commercially important products could run out before we can replenish them?
The Shopify Inventory Analytics guide goes deeper into stock velocity and availability.
9. Checkout Abandonment and Recovery: Are High-Intent Shoppers Being Lost?
A shopper who begins checkout has shown stronger purchase intent than someone who simply visited the homepage. That makes checkout performance worth reviewing each week. Do not focus only on the number of abandoned checkouts. Look at whether:
- Checkout starts increased or decreased
- Completion became weaker
- Recovery improved or declined
- A technical change occurred
- Shipping or payment behavior changed
Google Analytics provides a Checkout journey report specifically for reviewing the movement from checkout start through later checkout stages and purchase.
If your checkout completion suddenly deteriorates while traffic and add-to-cart activity remain healthy, that deserves faster investigation than a small change in a low-impact dashboard metric.
10. Refunds and Returns: Did the Week Look Better Before the Sales Came Back?
Revenue can look healthy when the order is placed. The picture becomes less attractive if more of that value is later refunded or returned. A weekly review should therefore check whether refunds or returns changed materially. Do not stop at: Refunds increased 20%.
Ask whether they are concentrated. If one product explains most of the increase, investigate that product. If the increase affects many products, there may be a broader issue involving fulfillment, delivery expectations, promotions or customer experience.
Not every week needs a major refund investigation. The purpose of the metric is to make unusual movement visible early.
Do You Need to Review Profit Every Week?
If you have reliable cost data, yes. Revenue growth does not automatically mean profitable growth. A week with high sales can still perform poorly financially if discounting, advertising costs, product costs, shipping subsidies or returns increased sharply.
However, do not put a misleading profit estimate on your main dashboard just because you feel you should track profit. If cost-of-goods, marketplace fees, fulfillment expenses or ad spend are incomplete, the result may create false confidence.
Use financial metrics when the underlying data is sufficiently complete to support the decision. For many store owners, revenue and operational analytics can be reviewed weekly, while detailed profitability is reconciled separately through accounting or financial reporting systems.
How Many Metrics Should a Weekly Ecommerce Dashboard Have?
You probably do not need 30. For most stores, around 6 to 10 primary weekly signals is enough to create a useful operating view. A practical setup might include:
- Revenue
- Orders
- Average order value
- Traffic or marketplace visibility
- Conversion or purchase completion
- New vs returning customer activity
- Major product movers
- Inventory risk
- Checkout performance
- Refund or return changes
Not every business needs all ten. A marketplace-only seller may care less about website sessions and more about marketplace impressions.
A subscription-heavy store may place much more emphasis on repeat purchasing. A high-ticket furniture store may review customer retention differently from a consumables business. Your scorecard should match how your business actually makes money.
What Percentage Change Should Trigger Investigation?
There is no universal threshold. A 5% movement may be meaningful for a large, highly stable store but meaningless for a small business with naturally volatile weekly orders. Instead, establish your own normal range.
If revenue typically moves within 5% from one ordinary week to another, a 25% decline is unusual. If your store regularly swings 30% because of campaigns and low order volume, a 10% change may tell you very little. Consider three things:
- Size: How large is the movement?
- Persistence: Did it happen only once or continue?
- Business impact: Does the change affect something commercially important?
This is why experienced ecommerce analysis relies increasingly on exceptions, not simply red and green percentages.
Avoid Turning Every Green Number Into Good News
A weekly dashboard can create false positives. Orders increased. Great.
- But what if AOV collapsed? Traffic increased. Great.
- But what if conversion fell because the new traffic was poorly qualified? Returning-customer rate increased. Great.
- But what if it only increased because new customer acquisition collapsed? Inventory decreased. Great.
- But what if your best seller is about to stock out? Metrics need relationships.
This is also why the earlier guide to ecommerce metrics that matter focuses on choosing numbers based on the decision they support. Your weekly scorecard takes that idea one step further by turning those numbers into a repeatable operating routine.
A 20-Minute Weekly Ecommerce Review
You do not need a two-hour reporting meeting every Monday. A focused review can follow this order.
First 5 Minutes: Check the Store-Level Result
Review revenue, orders and AOV against the previous comparable week. Write down the largest meaningful change. Do not investigate yet.
Next 5 Minutes: Check Demand and Conversion
Review traffic or marketplace visibility and purchase completion. Determine whether the store had a demand problem, a conversion problem or neither.
Next 5 Minutes: Check Customers and Products
Look at new versus returning customer activity. Then identify the products that contributed most positively and negatively to the week. Check inventory around commercially important products.
Final 5 Minutes: Check Revenue Leakage
Review checkout performance, refunds and returns. Then identify the one to three issues that deserve follow-up. Your weekly conclusion should sound like this:
Revenue declined mainly because order volume fell. Traffic was stable, but conversion weakened after checkout starts, so checkout performance should be investigated first.
Or:
Revenue increased because a promoted product generated substantially more orders. Returning-customer activity remained stable, but inventory on the promoted product is now becoming tight.
That is a useful weekly report. A screenshot containing thirty metrics is not.
Weekly Metrics Should Lead to Owners and Actions
Every important exception should leave the meeting with an owner.
- If a high-revenue product is approaching stockout, who checks replenishment?
- If checkout completion deteriorated, who tests the checkout?
- If organic traffic fell, who investigates search performance?
- If returning-customer activity weakened, who reviews retention campaigns and customer behavior?
Analytics becomes much more valuable when the workflow is: Signal → Investigation → Owner → Action → Follow-up Without that final step, weekly reporting becomes a ritual instead of a management tool.
The Same Weekly Framework Works Across Ecommerce Platforms
The metric labels and reporting interfaces differ, but the weekly business questions are similar across Shopify, WooCommerce, BigCommerce, Adobe Commerce, Wix, Squarespace, Ecwid, PrestaShop, Shopware, Amazon, Etsy, eBay and custom ecommerce stores.
A Shopify merchant may review sessions and checkout reports. An Amazon seller may rely more heavily on marketplace impressions, listing traffic and product-level performance. An Etsy seller may use marketplace visits and listing data.
A WooCommerce merchant may combine store reporting with Google Analytics. The platform changes. The weekly questions remain:
- Are enough potential buyers finding us?
- Are enough of them purchasing?
- How much value is each purchase creating?
- Are customers coming back?
- Which products changed the result?
- Can inventory support demand?
- Where are we losing revenue?
That makes the framework useful even when the underlying data comes from different ecommerce systems.
Where Statty AI Fits Into the Weekly Review
As stores add more reports, platforms and sales channels, the weekly review can become fragmented.
Statty AI is designed to help ecommerce businesses bring important store-performance signals into a clearer analytics environment so merchants can understand what changed without manually assembling every answer from disconnected reports.
You can explore the current Statty AI analytics features or visit the Statty AI website to see how store intelligence, reporting and AI-assisted analysis fit together. For a weekly workflow, the important benefit is not displaying more numbers.
It is making it easier to move from: Something changed to: This is the part of the business we should investigate.
Final Thoughts
The best weekly ecommerce report is not the one with the most KPIs. It is the one that helps you understand what changed and what needs attention before another week passes. Start with revenue, orders and average order value.
Then check whether demand and conversion explain the result. Look at customer mix, product contribution and inventory risk. Finish by checking checkout performance, refunds and returns for signs of lost revenue.
If nothing significant changed, you do not need to manufacture a problem. If something did change, move into the deeper report connected to that issue instead of analyzing everything else.
That is the purpose of weekly ecommerce metrics. Not to keep you staring at dashboards. To help you finish the week knowing what happened, what matters, and what someone should do next.