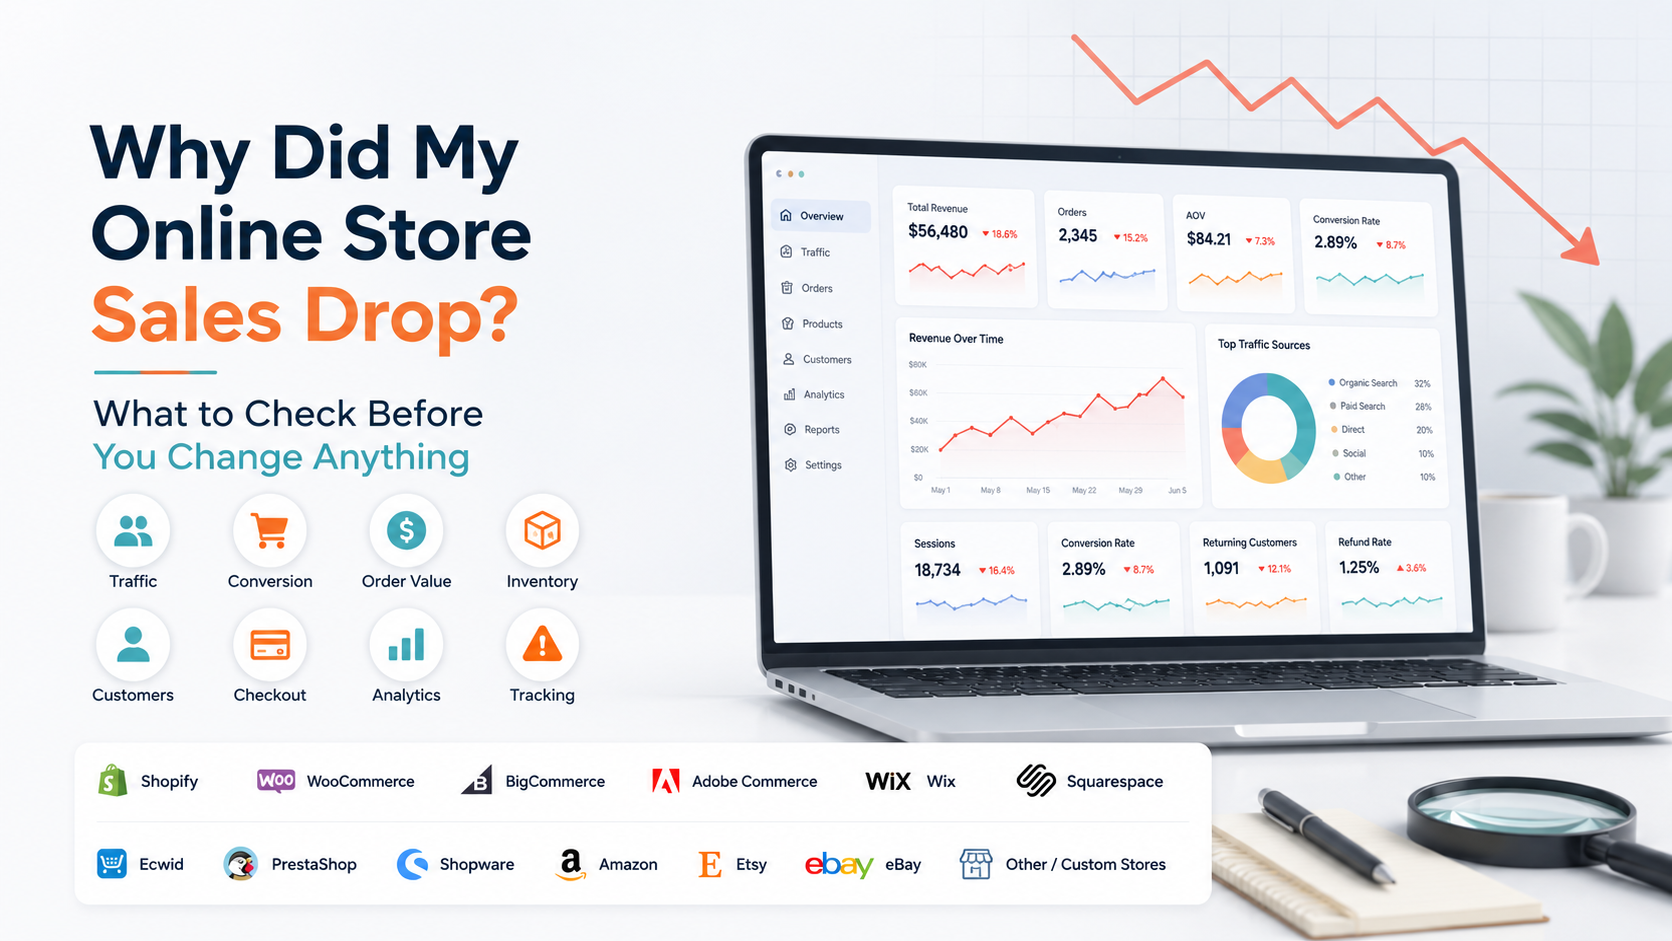
Yesterday your store was doing fine. This week revenue is down. Orders look weaker, and the first reaction is often to blame advertising, launch a discount, increase ad spend, or start changing product pages. That reaction can make the problem harder to diagnose. An online store sales drop is a result. It is not the cause.
Sales can fall because fewer people reached the store, fewer visitors purchased, customers spent less per order, important products became unavailable, returning customers purchased less, checkout stopped working properly, or your analytics simply stopped recording purchases accurately.
The useful question is therefore not just: Why are my sales down? It is: Which part of the buying process changed first? Once you answer that, the investigation becomes much smaller.
First Check Whether Sales Actually Dropped
Before looking for a cause, make sure you are comparing the right numbers. A partial Tuesday morning should not be compared with the whole of last Tuesday. A normal week should not be compared directly with Black Friday week.
A month containing a major promotion may create an unrealistic baseline for the month that follows. Start with completed, comparable periods. Compare the latest seven completed days with the previous seven days. If your business is highly seasonal, also compare with the equivalent period last year.
For short-term fluctuations, compare the same days of the week because weekend and weekday behavior can differ significantly. Google Search Console specifically recommends looking at weekly and monthly trends when you want to smooth daily changes such as weekends and holidays.
Also confirm that you are looking at the same definition of sales in both periods. Gross sales, net sales, total sales, orders, and payment receipts are not interchangeable. If the comparison itself is inconsistent, you can spend hours investigating a problem that does not really exist.
Use Three Questions to Find the Problem Faster
Most revenue declines can initially be narrowed down by looking at three areas:
- Did fewer people reach the store?
- Did fewer visitors become customers?
- Did customers spend less when they purchased?
In simplified terms, store revenue is heavily influenced by traffic, conversion, and order value. You do not need to analyze twenty reports at once. Start with these three questions and move deeper only when one of them shows a meaningful change.
Did Your Store Traffic Drop?
If sales fell and traffic also fell significantly, begin with acquisition rather than redesigning your checkout. The next question is where the missing visitors came from.
Google Analytics' Traffic acquisition report can separate traffic by source, medium, campaign, and other acquisition dimensions.
This makes it possible to see whether the decline came from organic search, paid advertising, email, social media, referrals, direct traffic, or another source. Suppose your store had:
- Last week: 20,000 sessions and 400 orders.
- This week: 15,000 sessions and 300 orders.
If conversion remains approximately similar, the main change may simply be that fewer people reached the store. That takes the investigation toward acquisition.
If Organic Traffic Dropped
Open Google Search Console and compare clicks and impressions with the previous equivalent period. Google's Performance report shows clicks, impressions, click-through rate, and average position, and lets you break performance down by query, page, country, and time.
Look at the relationship between impressions and clicks. If impressions fell significantly, your pages may be appearing less frequently for the searches that previously generated traffic.
If impressions remained relatively stable but clicks fell, investigate click-through rate, search-result appearance, query mix, and which pages lost clicks.
Do not judge the entire site from average position alone. Google recommends paying particular attention to trends in impressions and clicks when analyzing search changes.
If Paid Traffic Dropped
Check whether spend, impressions, clicks, campaign status, targeting, or budgets changed around the same date as the sales decline. Do not assume the store itself is broken if the advertising source simply delivered fewer qualified visitors.
Likewise, higher traffic does not automatically mean healthier acquisition. A campaign can generate more visits while bringing people with weaker buying intent. Look at both the quantity and quality of traffic.
If You Sell Through Marketplaces
For Amazon, Etsy, eBay, and other marketplace stores, investigate marketplace-specific visibility as well. Check whether product impressions, listing traffic, advertising activity, inventory availability, pricing, account notifications, or the visibility of important listings changed.
A marketplace seller can lose sales without a traditional website traffic problem because discovery happens largely inside the marketplace itself. The same diagnostic principle still applies: Did fewer potential buyers see the products?
What If Traffic Is Stable but Sales Are Down?
This is one of the most common questions merchants ask. If traffic remained relatively stable while orders fell, look at conversion next. The problem is probably happening somewhere between the visitor arriving and the purchase being completed.
Do not immediately change the entire website. First identify where people started dropping out. Google Analytics' Purchase journey report can show movement through session start, product view, add to cart, begin checkout, and purchase.
The report is specifically designed to reveal where users are dropping out of the purchase funnel. This lets you narrow the problem. If product views remain healthy but add-to-cart activity falls, investigate the product-page stage.
If carts remain healthy but fewer visitors begin checkout, investigate what happens between cart and checkout. If people begin checkout but fewer purchase, investigate the checkout itself. That is much more useful than simply saying: Our conversion rate dropped.
Check Where the Buying Journey Changed
A conversion problem becomes easier to investigate when you identify the exact stage where behavior changed.
- Product Views Are Down
This can happen even when total site traffic looks stable. Perhaps visitors are landing on blog pages, informational pages, or weaker landing pages instead of commercially important product pages.
Check which landing pages gained or lost traffic and whether visitors are still reaching the products that normally generate sales.
- Product Views Are Stable but Add to Cart Is Down
Now look at what shoppers see on the product page. Possible areas to inspect include price changes, unavailable variants, confusing product information, weak imagery, unexpected changes to shipping information, missing trust information, mobile layout problems, or a recently installed app interfering with the page.
Do not assume one of these is definitely the cause. Use the date of the decline and recent website changes to narrow the possibilities.
- Add to Cart Is Stable but Checkout Starts Are Down
Review the cart experience. Did shipping expectations change? Was a free-shipping threshold removed? Is a cart app behaving incorrectly? Has an upsell or popup made the next step harder to find? Test the process yourself on both desktop and mobile.
- Checkout Starts Are Stable but Purchases Are Down
This deserves immediate attention because shoppers are reaching a high-intent stage and failing to complete the transaction. Google Analytics' Checkout journey report can show progression from beginning checkout through shipping, payment, and purchase when the required ecommerce events are implemented.
Google specifically notes that a large drop between checkout stages can point you toward issues such as shipping costs or problems with that stage of the journey.
Now investigate payment methods, shipping rates, checkout errors, unexpected charges, discount-code behavior, required account creation, and other changes that could interfere with completion. Run a real test order if practical. Do not rely only on analytics when the checkout itself may be malfunctioning.
Why Did Sales Drop Even Though Orders Stayed Similar?
If order volume looks normal but revenue is down, check how much customers are spending per order. This is where average order value becomes useful. Shopify defines average order value as the average value of orders placed during the selected period.
Its analytics also lets merchants review orders, sales, and AOV together. Imagine the store usually receives 500 orders generating $50,000. This week it still receives around 500 orders, but revenue falls to $42,000.
The store has not suddenly lost its ability to generate transactions. Customers are simply producing less value per transaction. Investigate whether higher-priced products sold less, customers purchased fewer items, discounting increased, bundles stopped selling, or product mix moved toward lower-value items.
This prevents a common mistake: spending more money to generate additional traffic when the real change happened inside the basket. For a deeper breakdown of this relationship, see the Shopify Sales Analytics guide.
Check Whether a Best Seller Went Out of Stock
A store-wide sales decline can sometimes be caused by only one or two products. Imagine your highest-revenue product normally generates 25% of weekly sales. It goes out of stock for five days. Overall store revenue falls.
If you only look at the store-level number, you may conclude that demand weakened. In reality, customers could not purchase one of the products that normally generates a large share of revenue.
That is why product performance and inventory availability should be checked together. Compare products that lost the most sales with their available inventory during the same period. If a major product's sales dropped at approximately the same time its available stock disappeared, inventory deserves attention before marketing.
The Shopify Inventory Analytics guide explains how to connect inventory quantities with demand and sales velocity. For businesses experiencing repeated stock problems, the Shopify Low-Stock Alerts guide also explains how thresholds can be set before products reach zero inventory.
What If Only One Product's Sales Dropped?
Do not treat a product decline as a store-wide problem until you check the product itself. Compare the affected product with the rest of the catalog. If most products remain stable but one product falls sharply, examine its own environment.
Check whether its inventory changed, price changed, promotion ended, product page was edited, important variants became unavailable, advertising stopped, reviews changed, marketplace visibility shifted, or competing products inside your own catalog began taking more demand.
You may also discover that demand simply returned to normal after an unusually strong previous period. Product-level problems require product-level analysis.
Check New and Returning Customers Separately
Sometimes traffic remains healthy, conversion looks reasonable, and no major product is unavailable, yet revenue still weakens. Customer mix can explain part of the difference.
Suppose new-customer sales remain stable, but customers who previously purchased from you are buying less frequently. Total sales may begin declining even though acquisition has not collapsed.
This is why customer retention should be part of a sales-drop investigation, particularly for businesses that depend on repeat purchases. Compare the number of new customers, returning customers, and revenue generated by each group.
Do not look only at returning-customer percentage. A percentage can move simply because new-customer volume changed. Our Shopify Customer Retention Analytics guide explains how to compare returning behavior and cohorts more accurately.
Ask Whether a Promotion Created an Artificial Baseline
A sales decline sometimes looks worse because the previous period was unusually strong. Suppose you ran a large sale last week and revenue increased 40%. This week revenue returns close to its normal level. Your dashboard now reports a dramatic week-over-week decline. Technically, sales fell.
But the business may not have developed a new problem at all. The comparison period was exceptional. Whenever you see a sudden decline, mark important events in both periods:
Promotions, product launches, influencer campaigns, email sends, holiday weekends, payday effects, seasonal peaks, marketplace events, and unusually large orders can all distort a short comparison. The correct question is: Are sales below normal, or simply below an unusually strong period? Those are not the same thing.
Check Discounts and Pricing Changes
Price changes can influence several metrics at once. Suppose you remove a promotion. Revenue may fall because fewer customers purchase, because average order value changes, or simply because the promotional period created an unusually high order count.
Alternatively, aggressive discounting can generate additional orders while producing less revenue per transaction. Look at what changed in price, promotions, average order value, and order volume at the same time. Avoid judging the pricing decision from revenue alone.
Look at Refunds, Returns, and Cancellations
Strong order activity does not always mean the same amount of revenue remains with the business. If refunds, returns, or cancellations increased, the store's retained sales result may weaken even when initial order generation looks healthy.
Look for concentration. Are adjustments spread across many products, or does one product account for a large share?
If one product is responsible for most of the change, the problem may relate to product expectations, sizing, quality, fulfillment, or another product-specific issue. Again, analytics tells you where to investigate. It does not automatically prove why customers returned an item.
Could Your Analytics Be Wrong?
Yes, and this should be checked before making a major business decision. Your ecommerce platform may show orders while Google Analytics shows a decline in purchases. That does not automatically mean real sales disappeared.
Google Analytics requires ecommerce events such as purchase activity to be implemented correctly. Google also provides diagnostics for issues such as purchase events not being sent, missing transaction IDs, or problems with imported purchase data.
If analytics shows a sudden overnight collapse but your order-management system still contains normal purchase volume, investigate measurement first. Check your actual store orders, payment records, and platform reporting before relying on a third-party analytics tool.
This is particularly important after changes to tracking tags, consent management, themes, checkout configuration, plugins, apps, or analytics integrations. A reporting problem should not trigger a marketing emergency.
What If Sales Dropped Immediately After a Website Change?
Timing gives you a strong clue, although it does not prove causation. If sales were stable until a specific change and then declined immediately afterward, review that change carefully.
Common examples include a theme update, checkout customization, payment integration change, new plugin or app, product-template edit, shipping configuration update, tracking-script change, or mobile-layout issue.
Compare behavior before and after the deployment. Then test the actual customer journey instead of assuming the change is harmless because the website still loads. A site can look visually correct while a button, variant selector, discount, shipping rule, or payment step behaves incorrectly.
Mobile and Desktop Can Hide Different Problems
Overall conversion rate can conceal a device-specific issue. Suppose desktop conversion remains stable while mobile conversion falls sharply. Looking only at the blended store conversion rate makes the problem harder to see. Break performance down by device when your analytics supports it. Then test the affected experience yourself.
A recently introduced sticky banner, popup, oversized image, broken menu, poorly positioned button, or checkout display issue may affect mobile customers more severely than desktop visitors. Do not redesign the whole site before identifying whether the problem is isolated.
How Do You Know Whether Marketing or the Website Is the Problem?
Use the position of the drop. If fewer qualified visitors are reaching the store, acquisition deserves attention. If visitor volume remains healthy but fewer people view products, add products to cart, or begin checkout, investigate the website and offer.
If checkout starts remain strong but purchases fall, investigate the final checkout and payment experience. If purchases remain stable but revenue declines, look at average order value and product mix.
If all of those remain healthy but net revenue weakens, review refunds, returns, cancellations, or reporting definitions. This is much faster than having the marketing team, development team, and merchandising team all change things simultaneously.
Do Not Change Five Things at Once
When revenue falls, urgency can create bad experimentation. A business might increase ad spend, add a 20% discount, redesign the product page, change shipping, and send a win-back campaign in the same week.
Sales then recover. What fixed the problem? You no longer know. Once you identify the most likely weak point, make the smallest reasonable change that addresses it and monitor the relevant metric. This protects your ability to learn from the result.
A Practical Sales-Drop Investigation
Imagine an online store reports a 17% revenue decline compared with the previous week. Traffic is only down 2%, so acquisition probably does not explain most of the difference. Orders are down 14%, while average order value remains relatively stable.
You examine the purchase funnel and discover that product views and add-to-cart activity look normal, but checkout completion declined sharply.
Now you have narrowed the problem from: Revenue dropped 17%. To: Visitors are still arriving and showing buying intent, but fewer shoppers who begin checkout are completing purchases. That is a much better problem to investigate.
You can now test checkout, review payment methods, shipping changes, error messages, device performance, and recent configuration updates. Without that sequence, you might have increased advertising and simply sent more people into the same broken experience.
How Long Should You Wait Before Reacting to a Sales Drop?
It depends on the size and nature of the change. A 5% decline over one quiet day may be normal variation. A 50% overnight drop while traffic remains stable deserves immediate investigation.
The more dramatic and unusual the change is compared with your normal range, the faster you should investigate. Also consider business volume.
A store processing thousands of orders per day can detect meaningful changes much faster than a store receiving ten orders per month. The key is to compare the decline with your own normal behavior rather than using one universal rule.
Use a Simple Order of Investigation
When online store sales fall, work through the problem in this order:
- Validate the decline. Compare equivalent periods and confirm the reporting data is accurate.
- Check traffic. Determine whether fewer potential customers reached the store and identify the affected channel.
- Check conversion. Find where the buying journey started losing more people.
- Check order value. Determine whether customers are simply spending less per purchase.
- Check products and inventory. Identify major products that lost sales or became unavailable.
- Check customer mix. Look for weakening returning-customer activity.
- Check checkout and technical changes. Test payment, shipping, apps, themes, and the actual purchase flow.
- Check refunds and adjustments. Confirm whether completed revenue is later being reversed.
- Add business context. Consider promotions, seasonality, marketplace events, campaigns, and other changes before deciding what to fix.
The purpose of this order is not to prove the cause instantly. It is to eliminate broad possibilities and move toward the part of the store where the evidence actually changed.
The Same Logic Works Across Ecommerce Platforms
The reporting interface may change, but the core diagnosis remains similar whether you run a Shopify, WooCommerce, BigCommerce, Adobe Commerce, Wix, Squarespace, Ecwid, PrestaShop, Shopware, Amazon, Etsy, eBay, or custom ecommerce store. You still need to understand:
- Did demand disappear before customers reached the store?
- Did visitors arrive but stop purchasing?
- Did spending per order fall?
- Did important products become unavailable?
- Did returning customers stop coming back?
- Did checkout or payment fail?
- Did the reporting system itself break?
Those questions are platform-independent. The exact reports and integrations you use to answer them will depend on your ecommerce setup.
Where Statty AI Fits
A sales decline becomes harder to diagnose when sales, customers, products, inventory, refunds, and checkout activity live in separate reports.
Statty AI is designed to bring core business performance signals into a clearer analytics environment so merchants can investigate important changes without manually moving through disconnected data sources. You can explore the current Statty AI analytics features or visit the Statty AI website to learn more.
For Shopify specifically, the current Statty AI experience connects sales, orders, customers, products, inventory, checkout activity, and AI-powered insights to help merchants investigate store performance.
The important role of analytics is not to automatically announce that “marketing caused the decline” or “inventory caused the decline.” It should help you find the evidence that deserves investigation.
Final Thoughts
When online store sales drop, resist the urge to fix the first thing that comes to mind. Start by confirming that the decline is real. Then determine whether the change happened in traffic, conversion, order value, products, inventory, customers, checkout, or post-purchase adjustments. Follow the numbers in sequence.
- If traffic disappeared, investigate acquisition.
- If traffic remained but orders disappeared, investigate conversion.
- If orders remained but revenue fell, investigate order value.
- If only certain products declined, investigate those products and their availability.
- If everything appears normal but analytics collapsed, investigate tracking.
That approach turns a stressful question like “Why did my online store sales drop?” into a much more manageable one: Where exactly did performance change first?
Once you know that, you have a much better chance of fixing the right problem instead of creating three new ones.