An online store can collect sales data without dealing with big data. The distinction becomes important when information starts arriving from many places, in different formats and at a scale or speed that ordinary reporting tools struggle to handle efficiently.
A growing ecommerce business may have orders in one platform, website events in another, customer history in a CRM, ad performance across several networks, inventory in an ERP, reviews in free text, support conversations, marketplace activity and product data spread across multiple systems.
That is where big data analytics in ecommerce starts to become useful. The purpose is not to collect the largest possible dataset. It is to connect enough reliable information to discover patterns that would be difficult to see from one report alone, then turn those patterns into decisions.
IBM describes big data using five characteristics: volume, velocity, variety, veracity and value. In practical terms, that means large amounts of information, arriving quickly, from different sources, with varying levels of reliability, and with a need to produce useful business value from it.
Big Data Is Not Just “A Lot of Orders”
A business with 100,000 orders does not automatically need a complex big data system. The challenge usually appears when several dimensions combine.
You may have millions of browsing events arriving continuously, purchase history across years, thousands of products, customer interactions from different channels, text reviews, advertising data and inventory movements from several locations.
Traditional ecommerce reporting is usually strong at answering questions such as: How much did we sell last week? Big data analytics becomes more valuable when the question is more complex: Which combination of customer behavior, product interest, inventory availability and marketing source is associated with repeat purchasing?
That question may require several datasets to be joined before a useful pattern appears. If you are still building the fundamentals of store reporting, our ecommerce data analytics guide explains the more basic analytics layer first.
Think in Four Levels of Analytics
A useful way to understand big data is to separate analytics into four levels.
- Descriptive analytics explains what already happened.
- Diagnostic analytics investigates why it happened.
- Predictive analytics estimates what may happen next.
- Prescriptive analytics recommends or automates a possible response.
Shopify's 2026 enterprise analytics guidance uses the same four layer model and notes that ecommerce analytics can progress from historical reporting into demand forecasts, customer value predictions and automated actions.
Big data becomes especially useful in the predictive and prescriptive stages because models need enough historical information, behavioral signals and context to identify patterns reliably. The practical use cases below show what that means in an ecommerce business.
1. Build a More Complete View of Customer Behavior
A customer's relationship with a store rarely exists inside one order. They may discover the business through search, browse several products, return through an advertisement, subscribe to email, purchase one item, contact support, leave a review and purchase again three months later.
When those actions live in separate systems, each team sees only part of the relationship. Big data analytics can connect more of those signals into one customer view. That allows businesses to ask questions such as:
- Which acquisition sources produce customers who continue buying?
- Which products are frequently part of a customer's first purchase?
- Which behaviors usually happen before someone becomes a repeat buyer?
- Which previously valuable customers are becoming less active?
Google Cloud describes customer data platforms as a way to combine information from multiple systems and use machine learning for applications such as customer lifetime value forecasting and purchase propensity.The practical benefit is not simply having a bigger customer database. It is understanding the relationship between behaviors that were previously stored separately.
2. Create Product Recommendations From Actual Behavior
Recommendations are one of the clearest ecommerce big data use cases. A simple store can recommend products manually: Customers buying shoes may also need socks. A data driven recommendation system can go much further.
It can analyze product views, previous purchases, products commonly bought together, browsing sequences and similarities between customers to estimate what a particular shopper may be interested in.
Google Cloud provides reference architectures for recommendation systems built from ecommerce customer data, while its retail examples show recommendations being used to personalize products and promotions.
This does not mean every recommendation requires advanced machine learning. If your store has twenty products and a few hundred customers, manually designed complementary recommendations may work perfectly well.
Big data becomes more valuable when the catalog, customer base and number of possible product relationships become too large to manage manually.
3. Forecast Product Demand More Precisely
Inventory planning becomes difficult when tomorrow's demand is uncertain. Basic forecasting might use last month's sales average. A more advanced system can consider longer sales history, seasonality, promotions, product trends, marketing activity and other relevant signals.
Google Cloud's current retail forecasting documentation shows how historical ecommerce product and user event data can be aggregated and used to train forecasting models. AWS also provides a demand forecasting architecture that combines sales, product and marketing data for forecasting and anomaly monitoring.
Consider an online retailer selling 5,000 SKUs. Manually forecasting each item is unrealistic. A forecasting model can help estimate which products may experience rising or falling demand so purchasing teams know where deeper attention is needed. The output should still be treated as a forecast.
Unexpected events, supplier problems, viral products and sudden market changes can make historical patterns less reliable. Prediction reduces uncertainty. It does not remove it.
4. Make Inventory Decisions Before Stock Runs Out
Demand forecasting becomes especially useful when connected with inventory. Suppose a product has 300 units available. That number means little without demand information. If the product sells two units per day, inventory is probably comfortable.
If it sells 80 units per day and replacement stock requires two weeks, the business already has a potential problem. At scale, big data systems can monitor thousands of these relationships continuously.
They can combine historical demand, current stock, replenishment times, seasonal behavior and incoming inventory to identify products that deserve attention before they reach zero.
This is a more advanced extension of the same principle covered in our Shopify Inventory Analytics guide: inventory becomes much more meaningful when quantity is connected with how quickly products actually sell.
5. Identify Customers Who May Be Losing Interest
Churn prediction is another practical use case. A simple customer report tells you who has not purchased recently. A predictive model tries to identify which customers are behaving differently from what would normally be expected before they become inactive.
The model might consider recency, frequency, historical spending, typical time between orders, products purchased and other behavioral signals.
Google Cloud documents predictive use cases including customer lifetime value, propensity to purchase and churn modeling, while one of its retail customer examples uses RFM data and machine learning to identify customers likely to churn.
That distinction matters. A customer who has not purchased for six months is not automatically at risk. If they usually purchase once per year, their behavior may be completely normal.
A customer who normally purchases every three weeks and suddenly disappears for four months is a much stronger signal. Big data can help models learn those differences instead of applying one inactivity rule to everyone.
6. Understand Which Customers May Become More Valuable
The same approach can be used in the opposite direction. Instead of asking: Who might stop buying? you can ask: Which customer relationships appear likely to become more valuable?
Customer lifetime value models can use historical spending, purchasing frequency, product behavior and other signals to estimate potential future value. This can influence acquisition, retention and service decisions. For example, two advertising channels may acquire customers at approximately the same cost.
Channel A customers make more first purchases.
Channel B customers make slightly fewer first purchases but continue ordering for much longer.
Looking only at first purchase acquisition may favor Channel A. Longer term customer analytics could make Channel B more attractive. The important word is estimate. Predictive lifetime value is not guaranteed revenue. It is a probabilistic signal that helps businesses prioritize attention.
7. Detect Unusual Transactions and Fraud Patterns
Ecommerce fraud is another problem where large scale and fast moving data can matter. A suspicious transaction may not look suspicious when examined alone. The pattern becomes clearer when compared with historical behavior.
Machine learning systems can evaluate combinations of signals such as transaction history, device information, IP characteristics, payment information, account behavior and known examples of fraudulent transactions.
Amazon's fraud detection documentation describes supervised machine learning models trained on legitimate and fraudulent historical transactions, with use cases including guest checkout fraud, promotion abuse and fake reviews.
The advantage of big data here is speed as well as volume. Fraud decisions often need to happen while the transaction is still taking place.
That is one reason data velocity matters. IBM notes that high velocity data is particularly relevant where the value of the information decreases quickly, including fraud detection and real time customer interactions.
8. Find Checkout Problems Across Large Numbers of Sessions
A store with 50 orders per month can manually inspect individual checkout issues. A store with millions of sessions cannot. Big data analytics can analyze large volumes of behavioral events to identify where groups of shoppers repeatedly leave.
The useful analysis might compare checkout completion by device, traffic source, customer type, country, product category or time period. Suppose the overall checkout rate falls only slightly. At first, the problem appears minor.
A deeper breakdown shows that Android users on one browser version experienced a much larger decline immediately after a website update. The store wide average hid the technical issue. This is one of the biggest advantages of larger datasets. You can investigate subgroups without relying only on the overall average.
9. Evaluate Marketing Beyond Clicks and First Orders
Marketing platforms generate enormous volumes of data. Impressions, clicks, sessions and conversions can be useful, but they rarely tell the entire commercial story. A more connected analysis can ask:
- Which campaigns generate repeat customers?
- Which audience produces higher lifetime value?
- Which campaign generates large order volume but unusually high refunds?
- Which advertising source attracts visitors who browse extensively but rarely purchase?
- Which acquisition channel tends to introduce customers who later purchase premium products?
The purpose is to connect marketing activity with what happens after acquisition. Google Cloud's analytics materials describe using connected analytics data for predictive audiences, customer value modeling and marketing forecasting. This can help merchants move beyond optimizing campaigns for the easiest conversion to measure.
10. Analyze Reviews and Customer Feedback at Scale
Not all ecommerce data fits neatly into rows and columns. Reviews, support tickets, chatbot conversations and survey responses contain valuable information, but much of it is unstructured text. A store receiving thirty reviews per month can read them manually.
A marketplace seller or large retailer receiving tens of thousands of comments may need a scalable way to detect recurring patterns. Text analytics can help group feedback around themes such as:
- Product quality
- Sizing
- Packaging
- Shipping delays
- Product expectations
- Customer service
- Missing features
Sentiment analysis can also help separate broadly positive, negative and neutral feedback, although sentiment scores should not replace reading important customer comments.
Google Cloud lists large scale sentiment analysis of reviews and social feedback as an analytics use case for identifying customer pain points and possible product improvements.
The practical goal is not to know that 17% of comments were negative. It is to understand what customers repeatedly complain about and which products or processes those complaints relate to.
11. Understand Returns Instead of Treating Them as One Number
Returns data becomes much more useful when connected with product, customer and fulfillment information. Suppose one product has a high return rate. That is a useful starting signal.
Big data analysis can investigate whether returns are concentrated around a specific size, variant, supplier batch, location, acquisition channel or customer group.
Imagine a fashion retailer discovers that one size of a particular product is returned disproportionately often, and customer comments repeatedly mention that the fit runs smaller than expected.
That creates a much more actionable problem than simply knowing that returns increased. The merchant might review sizing information, product descriptions or supplier consistency before spending more money promoting the product.
12. Detect Anomalies Before Someone Notices Them Manually
One of the less glamorous but very practical uses of big data is anomaly detection. A business may monitor thousands of products, locations, customer segments and transactions. Nobody can manually examine every metric continuously. Analytics systems can detect unusual behavior such as:
- A normally stable product suddenly losing sales.
- A fulfillment location experiencing abnormal cancellations.
- A sharp increase in refunds.
- An unexpected drop in checkout completion.
- A high revenue product approaching stockout unusually quickly.
- A previously stable customer segment becoming less active.
AWS's demand forecasting guidance includes sending anomalous sales behavior to dashboards where alerts can be configured for action. The system does not need to know the exact cause immediately. Its first job is to tell the business: This behavior is unusual enough that someone should investigate it.
Does Big Data Mean Real Time Data?
Not necessarily. Some ecommerce decisions benefit from very fast data. Fraud detection may need to happen within seconds. Stock availability may need frequent updates. Recommendations may become more relevant when recent browsing behavior is included.
Other decisions do not require real time processing. Customer retention analysis might be reviewed weekly or monthly. Long term demand planning may use months or years of historical information.
Businesses should not build real time infrastructure simply because it sounds advanced. The right question is: How quickly does this information need to change the decision? If tomorrow is soon enough, second by second processing adds complexity without much practical benefit.
Does a Small Ecommerce Store Need Big Data?
Usually, not in the technical enterprise sense. A smaller merchant does not need a data lake, distributed processing cluster and machine learning team just to understand revenue, customers and inventory.
IBM similarly notes that smaller businesses can benefit from big data analytics, while the infrastructure and sophistication required should reflect the problem being solved. Small stores should first make sure basic ecommerce analytics works properly.
- Can you trust your sales numbers?
- Do you understand which customers return?
- Can you see which products generate revenue?
- Can you identify inventory risk?
- Can you investigate checkout performance?
If those questions are still difficult, adding a complex big data architecture will probably make reporting harder rather than better. Big data becomes worthwhile when ordinary reports can no longer answer important questions efficiently.
What Data Does an Ecommerce Business Actually Need?
You do not need to collect everything. Useful data depends on the problem. A personalization system may need browsing, product and purchase behavior. Inventory forecasting needs product sales history, inventory movement and replenishment information.
Retention analysis needs customer purchase history and timing. Marketing analysis needs acquisition information connected with post purchase behavior. Fraud detection needs transactional and behavioral risk signals.
The worst approach is collecting large amounts of information without knowing why you need it. More data creates more storage, privacy, governance and quality responsibilities. A better rule is: Collect the data required to answer a defined business question, then make sure that data is accurate enough to support the decision.
Bad Data at Scale Is Still Bad Data
This is one of the most important realities of big data analytics. A larger dataset does not automatically create a better answer.
If customer records are duplicated, transaction definitions differ between systems, tracking events are missing or timestamps use inconsistent time zones, combining more information can actually create more confusion. This is the veracity problem within big data.
IBM specifically includes veracity, meaning data accuracy and reliability, among the core characteristics of big data because complex datasets can contain noise and errors that affect decisions. Before building advanced predictions, businesses need consistent definitions.
- What counts as revenue?
- How is a return recorded?
- When does someone become a returning customer?
- Which inventory quantity is considered available?
- Which system is the source of truth?
Machine learning cannot rescue poorly defined business data.
Do Not Collect Customer Data Just Because You Can
Big data also increases privacy and governance responsibility. Connecting customer behavior across multiple systems can create valuable insights, but businesses need to understand what information they collect, why they collect it, who can access it and how long it is retained.
The more data sources you combine, the more important permissions and governance become. An ecommerce analytics strategy should therefore ask two questions at the same time: Can we use this data? And: Do we actually need this data for the decision we are trying to make? Collecting unnecessary information creates risk without necessarily creating value.
Big Data Does Not Replace Business Judgment
Predictive models produce probabilities. Recommendation systems produce rankings. Anomaly detection produces warnings. Forecasts produce estimates. None of these automatically proves why something happened or guarantees what will happen next.
Suppose a model predicts that demand for a product will increase. The merchant may know something the model does not, such as a supplier ending production next month. Suppose analytics identifies a customer as likely to churn.
That customer may simply be following a normal seasonal buying pattern that has not yet appeared strongly in the historical data. Analytics should improve human decision making, not pretend uncertainty has disappeared. Our guide to turning ecommerce analytics into decisions explains this distinction in more detail.
How to Know If You Are Ready for Big Data Analytics
Before investing in a more advanced analytics setup, ask whether the business has reached the point where the additional complexity solves a real problem. A reasonable progression looks like this:
Stage 1: Reliable reporting
You can trust basic sales, customer, product and inventory data.
Stage 2: Connected analysis
You can relate several datasets instead of reviewing each independently.
Stage 3: Prediction
You have enough reliable historical information to estimate demand, churn, value or another future outcome.
Stage 4: Action
Predictions are linked to clear business responses.
Stage 5: Automation
Certain decisions can be triggered automatically within defined limits. Do not jump directly to Stage 5 because AI and automation sound attractive. If Stage 1 is unreliable, every later stage inherits the problem.
The Same Use Cases Apply Across Ecommerce Platforms
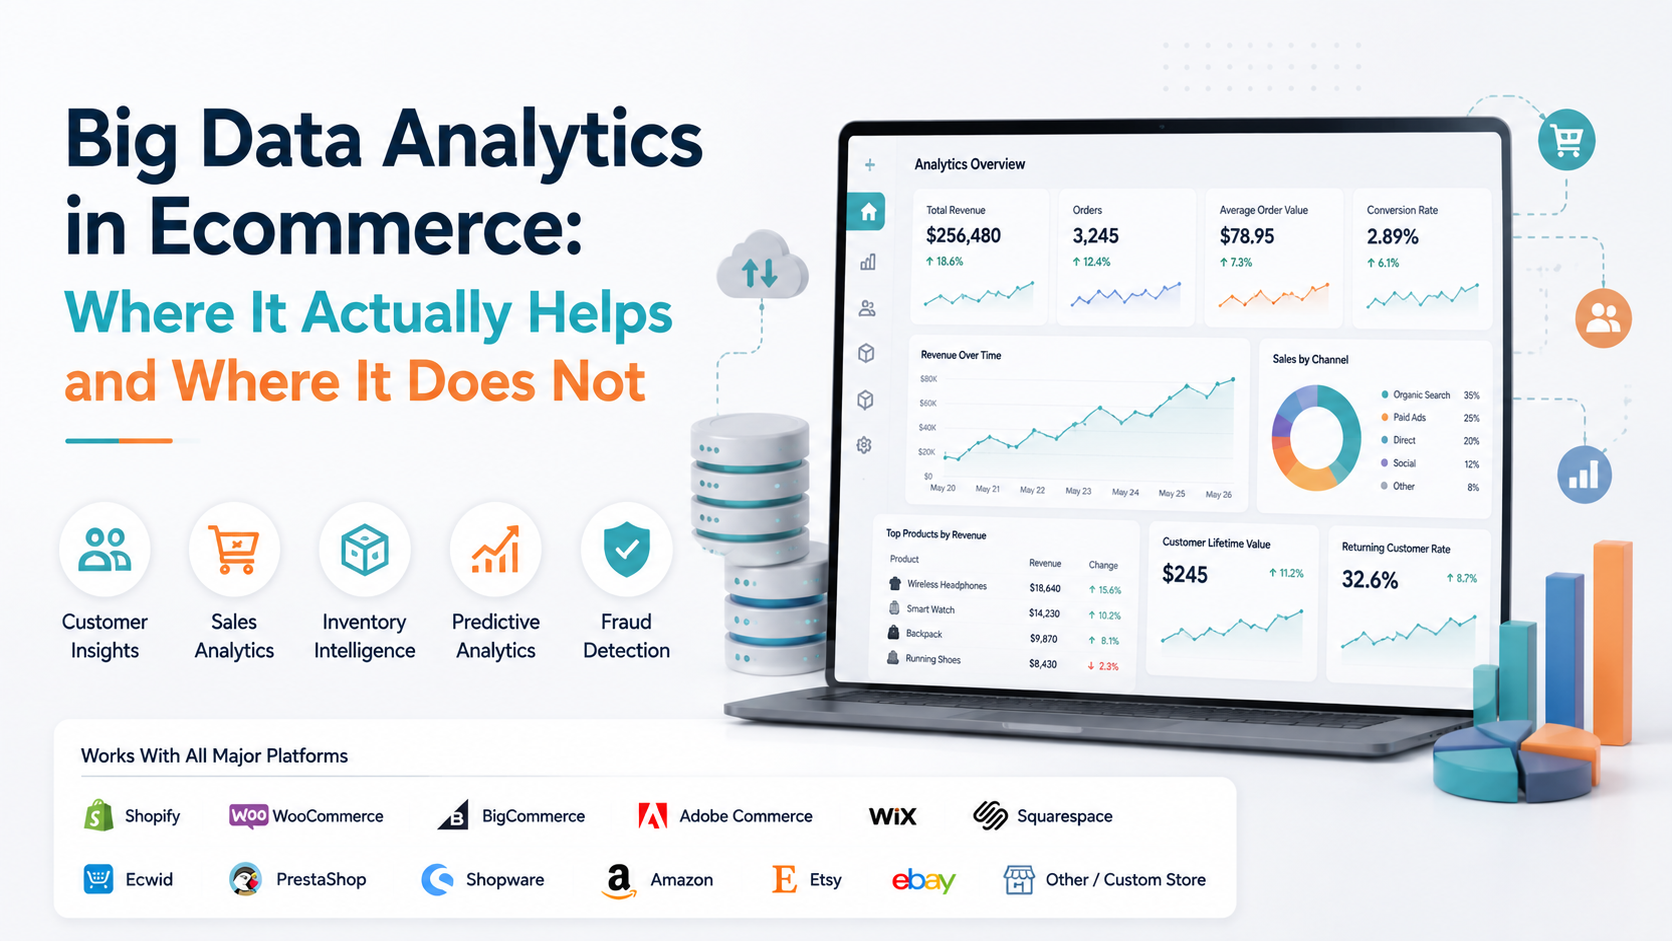
The underlying analytics principles are not limited to one ecommerce system. They can apply to Shopify, WooCommerce, BigCommerce, Adobe Commerce, Wix, Squarespace, Ecwid, PrestaShop, Shopware, Amazon, Etsy, eBay and custom ecommerce stores.
The available datasets and integrations will differ. A Shopify merchant may have rich storefront, customer, checkout and inventory information. An Amazon or Etsy seller may depend more heavily on marketplace listing, advertising and order data.
A custom commerce business may combine its storefront with CRM, ERP, warehouse and customer support systems. Big data analytics becomes valuable when those different signals can be connected around a real business question.
Where Statty AI Fits
The difficult part of analytics is often not collecting another dataset. It is bringing business information together in a way that someone can actually understand. Statty AI is designed around connected business intelligence, bringing sales, customers, products, inventory and operational signals into a clearer analytics environment with AI assisted insights.
You can explore the current Statty AI features or visit Statty AI to see how connected store analytics can reduce the need to interpret isolated reports manually. The value of a platform like this is not that it makes data bigger. The value is making the information you already generate easier to use.
Final Thoughts
Big data analytics in ecommerce becomes valuable when the business has more information than ordinary reporting can realistically connect and interpret. Its strongest practical use cases are not complicated dashboards for their own sake. They are real business problems:
- Understanding customer relationships across channels.
- Predicting product demand.
- Preventing avoidable stock problems.
- Finding customers whose behavior is changing.
- Personalizing recommendations.
- Detecting suspicious transactions.
- Finding checkout problems across large numbers of sessions.
- Connecting marketing activity with long term customer value.
- Analyzing thousands of reviews and returns.
- Detecting unusual business behavior before someone finds it manually.
The important question is therefore not: How much data can our store collect? It is: Which decision becomes better when we connect and analyze this data? If you cannot answer that question, you probably do not need a bigger data stack yet.
If you can answer it clearly, big data stops being a technology buzzword and becomes something much more useful: a way to find patterns that would otherwise remain hidden and turn them into better ecommerce decisions.