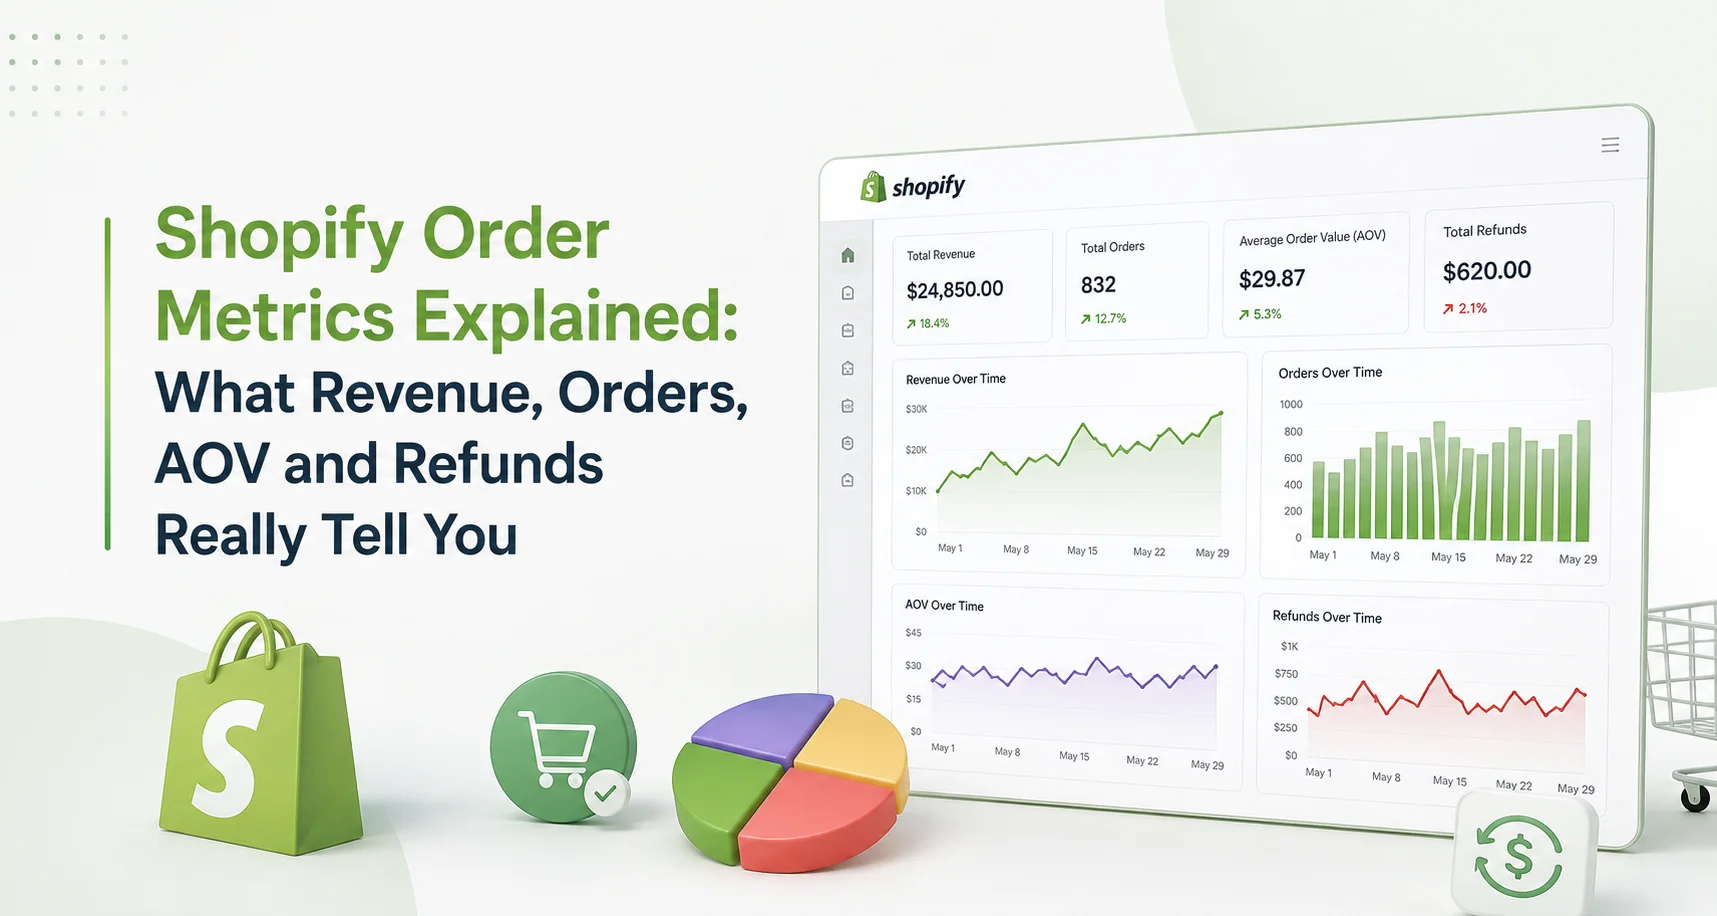
Four numbers are especially useful when you want to understand order performance: revenue, order count, average order value and refunds. Each answers a different question, but the real insight comes from reading them together.
If you understand the relationship between these metrics, a statement such as “sales were down this month” becomes much more useful. You can begin to explain whether the problem came from fewer purchases, smaller orders or money being returned after the sale.
Revenue Tells You the Result, but You Need the Right Revenue Number
The word “revenue” can create confusion because Shopify reports contain several sales measures. Shopify defines gross sales as product price multiplied by quantity before discounts, returns, taxes and shipping. Net sales account for discounts and returns, while total sales add elements such as taxes, duties, shipping charges and additional fees to net sales.
That distinction matters. Imagine two stores each show $50,000 in gross sales. One used very few discounts and had limited returns. The other ran aggressive discounts and experienced significant returns.
The gross figure is identical, but the commercial result is not. When analyzing revenue performance, make sure you know which sales measure your report is showing before comparing it with another period.
For many performance questions, net sales can be more informative than simply looking at the largest headline sales figure because it gives greater context around discounts and returns.
Order Count Shows How Many Purchases Created That Revenue
Revenue answers “how much?” Order count answers “how many?” Shopify's order reports provide information about order volume, fulfillment, shipping, delivery and returns, while its Analytics dashboard can track orders alongside sales and average order value.
This makes order count one of the first metrics to check when revenue changes. Suppose revenue increased from $30,000 to $36,000. If orders also increased by roughly 20%, the explanation may simply be that the store generated more purchases.
But imagine revenue increased 20% while order count barely changed. Now the story is different. Customers probably spent more per transaction, which makes average order value the next metric to investigate.
The reverse can happen as well. Orders may increase while revenue barely moves. That usually tells you that the average value of those orders has fallen. This is why “we got more orders” does not necessarily mean “we generated proportionally more revenue.”
Average Order Value Explains How Much Each Order Contributes
Average order value, or AOV, helps connect revenue and order volume. Shopify describes average order value as the average value of orders and includes it as a metric in its analytics and reporting system. The exact calculation can depend on the reporting context, which is why merchants should compare figures from consistent reports rather than mixing different definitions.
AOV becomes especially useful when revenue and orders are moving in different directions. Consider this example. Last month: 1,000 orders generated $60,000. This month: 1,020 orders generated $54,000. Order volume is slightly higher, yet revenue is lower.
The important signal is not the additional 20 orders. It is that customers are spending less per transaction. That should lead to questions such as:
Did customers buy fewer items?
Were higher-priced products unavailable?
Did discounts increase?
Did demand shift toward lower-priced products?
AOV does not provide the answer by itself. It tells you where the investigation should go next.
A Higher AOV Is Not Automatically Better
Merchants are often encouraged to increase average order value, but a higher AOV needs context. Suppose AOV increases because customers are buying more products in each order. That may be a positive sign.
But AOV might also rise because lower-value customers stopped purchasing and only a smaller number of high-spending customers remained. Revenue could even decline while AOV rises if order volume falls sharply enough. For example: Orders fall by 25%, while AOV rises by 10%.
The higher AOV does not compensate for the lost transactions. This is a good example of why individual Shopify order metrics should not be labelled “good” or “bad” without looking at their relationship with other numbers.
Refunds Change the Story After the Order Is Placed
An order being completed does not always mean the full value of that order remains with the business. Refunds can reverse some or all of the money associated with a transaction. There is an important Shopify reporting distinction here: returns and refunds are not the same reporting event.
Shopify explains that Sales reports include returns, while refunds are reflected in payment-related finance reporting. Merchants investigating refunded figures can also filter sales reporting by payment status. That means merchants should be careful when casually using “refunds” and “returns” as interchangeable metrics.
A return relates to merchandise being returned, while the refund represents money being returned through the payment process. Depending on the situation, their timing and reporting can differ. For business analysis, the important question is: How much of the value created by completed orders are we actually keeping?
Read Refunds at Product Level, Not Only Store Level
A store-wide refund figure tells you that something changed. It does not necessarily tell you where the problem is. Imagine refunded value increases by 18% this month. That deserves attention, but the next step should be to identify whether the increase is spread across the catalogue or concentrated around a particular product. If one product is responsible for most of the change, the investigation becomes much more focused.
You may need to review product expectations, descriptions, variants, sizing, quality, fulfillment or customer feedback. If refunds increased across many unrelated products, the issue may require a broader investigation. The useful insight is rarely: Refunds went up. It is more often: Refund activity increased primarily around these products or orders, so this is where we should investigate first.
What Different Metric Combinations Actually Mean
The four metrics become much more useful when you read them as combinations.
Revenue Up + Orders Up + AOV Stable
This is one of the clearer growth patterns. More transactions are being completed and average spending per order has remained relatively consistent. The next useful question is whether the growth is sustainable and where those additional orders came from.
Revenue Up + Orders Flat + AOV Up
Customers are spending more per transaction. Investigate product mix, bundles, upsells, pricing and whether higher-value products contributed more than usual.
Orders Up + Revenue Flat + AOV Down
The store is generating more transactions but extracting less revenue from each one. This can happen during discount-heavy promotions or when customers shift toward lower-priced products. Do not celebrate order growth without understanding the lower order value.
Revenue Down + Orders Stable + AOV Down
Purchase volume is not the main problem. Customers are placing roughly the same number of orders but spending less. Product mix, discounting and availability of high-value items deserve attention.
Revenue Down + Orders Down + AOV Stable
Customers are spending roughly the same amount when they buy, but fewer purchases are being completed. The investigation should move toward demand, traffic quality, conversion or customer activity rather than basket value.
Orders Strong + Refunds Rising
The store may appear healthy when looking only at completed purchases, but more of that value is being reversed afterward. Review the products and orders associated with the increase before assuming sales growth is as strong as the order count suggests. These combinations are often more useful than any single KPI.
Do Not Mix Order Metrics From Different Time Frames
Another common mistake is comparing metrics that do not represent the same period. You may compare this week's orders with this month's AOV or current sales with refund activity that relates to older purchases.
That can create misleading conclusions. Shopify's reporting system supports time-based analysis and period comparisons, and the Analytics overview dashboard can display sales, net sales, orders and AOV as related trends.
Whenever you investigate an order-performance change, begin with equivalent date ranges. Then remember that returns or refunds can occur after the original order date, so they may require separate interpretation rather than forcing them into a perfect same-day relationship.
An Order Is Not the Same as a Payment
This is another distinction that becomes important as reporting gets more detailed. Sales and order reports explain commercial activity. Finance reports provide information about payments and other financial activity. Shopify's Finance Summary currently brings together sales, payments, gift cards, tips and gross-profit information for a selected period.
So if you are asking: How many orders did customers place? That is an order question. If you are asking: How much did those orders generate in sales? That is a sales question. If you are asking: What money has actually moved through payments or refunds?
That becomes a financial-reporting question. Understanding the difference prevents merchants from assuming that every number appearing around an order should reconcile instantly to the same figure.
Build Your Order Review Around Exceptions
You do not need to analyze every order individually. A more practical approach is to look for situations where the relationship between metrics becomes unusual. For example: Revenue normally grows at roughly the same pace as orders, but this week orders increased while revenue did not.
AOV normally stays within a consistent range, but it suddenly falls. Refund activity is normally spread across many products, but one product begins generating a noticeable share. These exceptions tell you where to spend your time.
The purpose of an order metrics Shopify app or reporting dashboard should therefore not be to display as many figures as possible. It should make unusual relationships easier to notice.
Statty AI's Shopify analytics dashboard brings sales, orders, customers, products, inventory, checkout activity and other store information into one view so merchants can investigate changes with more context.
A Simple Order Review You Can Use Each Week
Start with your main sales figure and compare it with the previous equivalent period. Then check order volume. If revenue and orders moved at roughly the same rate, the explanation may be relatively straightforward.
If they moved differently, look at average order value. After that, review adjustments such as returns and refunded activity where relevant. Only then move deeper into products, customers or inventory to understand what contributed to the result.
This creates a much cleaner analytical path: Revenue → Orders → AOV → Returns/refunds → Cause It prevents the common habit of opening ten unrelated reports as soon as one number changes. For a broader approach to sales performance, read our Shopify sales analytics guide.
The Important Question Is Not “Which Metric Is Best?”
Revenue, orders, AOV and refunds are not competing KPIs. They answer different parts of the same business question. Revenue shows the value generated. Order count shows how many transactions contributed to it. Average order value explains how much each transaction contributed on average.
Refund and return activity helps show how much of the original transaction value may later be reversed. Read together, these Shopify order metrics help turn a broad statement such as “sales changed” into something much more useful: We received about the same number of orders, but customers spent less per purchase because higher-value products contributed less than usual.
Or: Orders increased during the promotion, but lower AOV and higher refunds reduced the quality of that growth. That is the real value of order analytics. You are not simply recording transactions. You are understanding what those transactions are actually doing for the business. For a connected view of store performance, explore Statty AI's AI-powered Shopify analytics app or learn more about its analytics and reporting features.