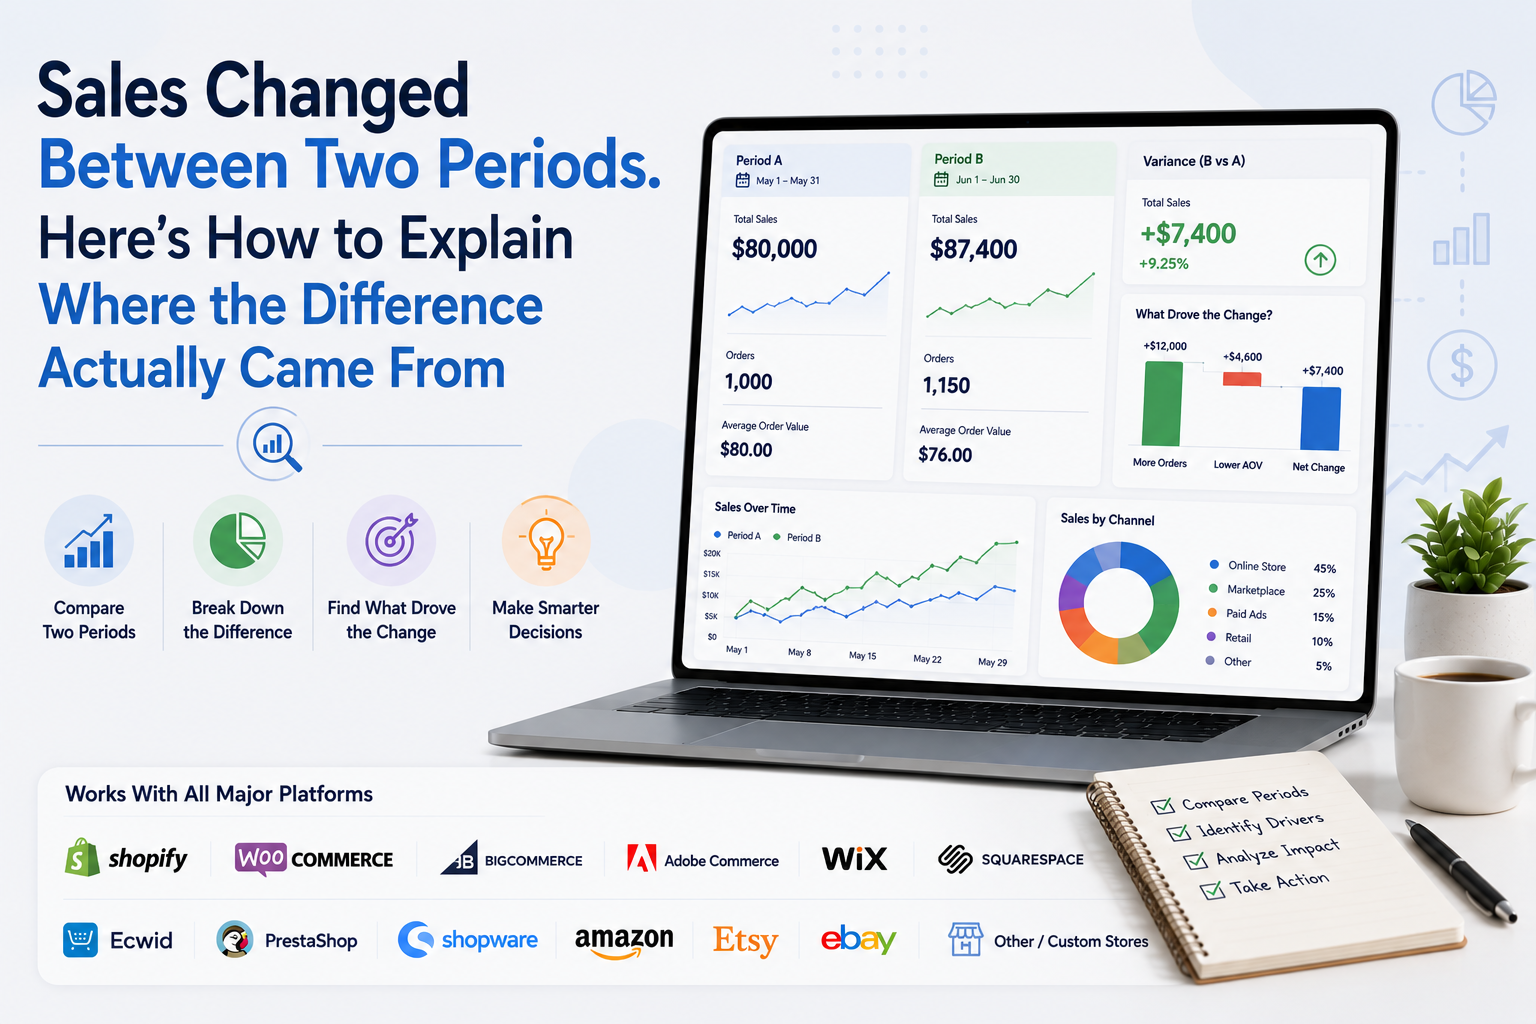
Your store generated $87,400 this month. Last month it generated $80,000. Sales increased by $7,400, or 9.25%. That comparison tells you what changed. It does not tell you how the additional $7,400 was created.
- Did you process more orders?
- Did customers spend more?
- Did one product suddenly take off?
- Did a new product create the increase?
- Did a new marketplace contribute sales?
- Were discounts lower?
- Did higher-priced products sell more frequently?
This is where ecommerce sales variance analysis becomes useful. Instead of stopping at "sales increased 9.25%," you break the difference between two periods into understandable pieces until you can explain where the movement actually came from.
The goal is not to create a complicated finance model. It is to turn one sales difference into a clear commercial story.
Start With One Number: The Sales Variance
Before looking at customers, products or channels, calculate the difference you are trying to explain. Suppose: Period A sales = $80,000, Period B sales = $87,400
The absolute variance is: $87,400 - $80,000 = +$7,400
The percentage variance is: $7,400 ÷ $80,000 × 100 = +9.25%
Both values matter. The percentage tells you how large the movement was relative to the starting point. The dollar amount gives you something concrete to reconcile.
Your analysis now has a clear objective: Explain the additional $7,400.
This sounds simple, but it changes the way you use reports. Instead of opening several dashboards and looking for interesting changes, every breakdown now has to help explain that $7,400.
Make Sure the Two Periods Are Actually Comparable
This article focuses on explaining the sales variance rather than choosing comparison periods, but the foundation still matters. Shopify currently allows merchants to compare custom reporting periods with a previous period, previous year or another custom range.
WooCommerce Analytics similarly supports previous-period and previous-year comparisons. GA4 also offers previous-period comparisons, including an option that matches weekdays.
If Monday through Sunday is being compared with another seven-day period that contains a different weekday mix, or a complete month is being compared with a partial month, you may start explaining a difference that is largely created by the comparison itself.
For the full methodology around selecting fair date ranges, use How to Compare Store Performance Between Two Periods. Once the dates are fair, move directly into the sales bridge.
First Break the Difference Into Order Volume and Order Value
At store level, one of the most useful ways to explain sales is: Sales ≈ Orders × Average Order Value The exact relationship depends on how your platform defines sales and AOV, but this provides a practical starting model.
Shopify, for example, currently defines orders separately from AOV and calculates its AOV using gross sales minus discounts divided by orders.
Its sales reporting also distinguishes gross sales, net sales and total sales, so you should keep the definitions consistent throughout your comparison. Consider this example.
- Period A
1,000 orders, $80 AOV, Sales = $80,000
- Period B
1,150 orders, $76 AOV, Sales = $87,400
Sales increased $7,400 even though customers spent less per order. How? The store processed 150 additional orders. You can separate the change mathematically.
Order volume effect: 150 additional orders × old $80 AOV = +$12,000
Now calculate the impact of AOV falling from $80 to $76: 1,150 current orders × -$4 AOV change = -$4,600
Combine them: +$12,000 order volume effect, -$4,600 order value effect = +$7,400 net sales difference
Now you know something far more useful than "sales increased 9.25%." The business generated enough additional transactions to overcome a decline in value per order. That immediately gives you two different questions:
- Why did order volume increase?
- Why did order value fall?
This Is Better Than Looking at Orders and AOV Separately
A normal dashboard might show: Orders: +15%, AOV: -5%, Sales: +9.25%
Those percentages are useful, but the sales bridge shows the financial contribution of each movement. In the example above, additional orders added approximately $12,000 of potential sales relative to the old AOV.
Lower order value removed $4,600. That gives the owner a much clearer understanding of the result. It also stops you from celebrating order growth without noticing that some of its benefit is being lost through smaller transactions.
Next, Find Which Products Added or Removed Sales
Once the store-level variance is clear, product contribution is usually the next useful breakdown. Do not start with a normal bestseller ranking. Ask: How much more or less did each product generate compared with the previous period?
Suppose your total sales variance is +$7,400.
Product A: +$9,000
Product B: +$4,000
Product C: -$3,000
Product D: -$2,600
Everything else combined: $0
Total: +$7,400
This tells you that overall growth was created primarily by Products A and B, while C and D offset part of that improvement. A normal "top products this month" report might miss this completely.
Product A could already have been your largest seller before the comparison period. What matters for variance analysis is not simply its current revenue.
What matters is how much its contribution changed. WooCommerce's category reporting follows a similar contribution-oriented idea by showing net sales, orders and items sold for categories across chosen and comparison periods.
Separate Existing Products From New Products
A particularly useful sales comparison is: Existing catalog growth versus New-product contribution. Suppose total sales grew by $25,000. Then you discover that products launched during the current period generated $22,000.
Existing products combined grew only $3,000. The business did grow. But that is very different from saying: Our existing catalog grew strongly.
A new product with no previous-period sales cannot meaningfully have a normal percentage growth rate because its starting value was zero.
Use absolute contribution instead: New Product X contributed $14,000 of current-period sales. This gives you a more honest comparison.
Do the Same for Discontinued or Unavailable Products
The reverse situation also matters. Suppose a product generated $18,000 in Period A and $0 in Period B because it was discontinued. Your overall store comparison contains an automatic -$18,000 contribution from that product.
Perhaps several newer products successfully replaced it. If you do not separate assortment changes, you may conclude that established products are weakening when the catalog itself simply changed. A useful ecommerce sales comparison can therefore include two views:
Total business sales and Like-for-like catalog sales
The like-for-like view compares products available in both periods. The total view tells you what actually happened to the company. Both are useful, but they answer different questions.
Go One Level Deeper: Was Product Growth Caused by More Units or Higher Realized Price?
Suppose Product A increased from $10,000 to $12,000. That $2,000 improvement could happen in several ways. Maybe you sold more units. Maybe the selling price increased., Maybe fewer discounts were used.
Maybe customers shifted toward a more expensive variant. A simple product-level quantity and value analysis helps separate these effects. Imagine:
- Period A: 200 units × $50 realized selling value = $10,000
- Period B: 250 units × $48 realized selling value = $12,000
Product sales increased $2,000. First calculate the quantity effect: 50 additional units × old $50 value = +$2,500
Then calculate the realized-value effect: 250 current units × -$2 change = -$500
Net: +$2,500 quantity contribution
-$500 value contribution
= +$2,000 product sales growth
Now the story becomes clear. The product grew because substantially more units were sold, even though the realized value per unit fell slightly. That is much more useful than simply seeing Product A at +20%.
Use Realized Selling Value When Discounts Matter
List price does not always explain the actual sales movement. A product may have a list price of $100 in both periods while the amount customers effectively pay changes because discounts become more common.
For sales analysis, the realized value per unit can therefore be more useful than list price alone. WooCommerce's Revenue report separates gross sales, coupons, returns, and net sales
While Shopify also maintains separate fields for gross sales, discounts, net sales, and total sales. This lets you distinguish: More products were sold from the same products generated less value because discounting increased.
Build a Sales Bridge From Gross Sales to Net Sales
Another valuable comparison is not by product or order count, but by how sales value was reduced. Suppose:
Period A
Gross sales: $100,000
Discounts: $8,000
Returns or reversals: $5,000
Net sales: $87,000
Period B
Gross sales: $115,000
Discounts: $14,000
Returns or reversals: $7,000
Net sales: $94,000
Gross demand increased $15,000. But discounts consumed an additional $6,000. Returns consumed another $2,000 compared with the previous period.
So only $7,000 of the $15,000 gross-sales improvement reached net sales. This tells a very different story from simply reporting that gross sales increased 15%.
WooCommerce's current Revenue report explicitly presents gross sales, returns, coupons, net sales, taxes, shipping, and total sales so merchants can see how those components contribute to the final result. A strong sales comparison should preserve that relationship.
If You Added a New Store or Marketplace, Separate Expansion From Like-for-Like Growth
This is especially important for multi-platform ecommerce businesses. Imagine:
- Period A existing channels = $200,000
- Period B same existing channels = $205,000
- New Amazon channel launched in Period B = $35,000
- Current total = $240,000
Headline sales growth: 20%, but sales from channels that existed in both periods grew only 2.5%. The remaining $35,000 came from expansion. Neither number is wrong. They describe different types of growth. A useful report should therefore show: Total company growth and Like-for-like channel growth
This becomes increasingly important when a business operates across Shopify, WooCommerce, BigCommerce, Adobe Commerce, Wix, Squarespace, Ecwid, PrestaShop, Shopware, Amazon, Etsy, eBay and custom stores. Otherwise, new channels can make existing-channel performance look stronger than it actually is.
Multi-Currency Stores Need Another Layer of Discipline
If two periods contain sales in different currencies, exchange-rate movement can influence the reported comparison. Shopify's current reporting allows report data to be displayed in another currency and uses the historical exchange rate from the transaction date for conversion.
For management analysis, multi-currency businesses may also create a constant-currency comparison. The idea is simple. Instead of allowing different exchange rates in each period to affect the result, translate both periods using the same chosen exchange-rate basis.
That helps answer: Did the underlying business grow, or did currency movement make reported growth look better or worse? Do not replace your normal financial reporting with constant-currency figures. Use them as an analytical view when foreign-exchange movement is large enough to distort operational comparisons.
Do Not Add Product Contribution and Channel Contribution Together
This is an important analytical mistake. Suppose: Product A contributed +$10,000, Amazon contributed +$8,000, You cannot automatically say those drivers created +$18,000. Why?
Because some or all of Product A's additional $10,000 may have been sold through Amazon. The same sale can belong to:
- A product.
- A channel.
- A customer group.
- A country.
- A campaign.
Those are different views of the same revenue, not separate amounts that should always be added together. For exact reconciliation, use one mutually exclusive dimension at a time. For example:
- All product contributions should add back to the total sales variance.
- All store contributions should add back to the same variance.
- All channel contributions should also add back to it, assuming the channel classification is complete.
Then use cross-analysis to investigate relationships. This one principle prevents a large amount of accidental double-counting.
Use a Variance Table Instead of a Giant Dashboard
A practical sales comparison can be summarized like this:
| Analysis Layer | Question It Answers |
|---|---|
| Total sales variance | How much did sales change? |
| Orders vs AOV | Was the change created by transaction volume or order value? |
| Product contribution | Which products added or removed the most sales? |
| Existing vs new products | Did growth come from the established catalog or assortment expansion? |
| Units vs realized value | Did individual products grow because more units sold or because value per unit changed? |
| Gross to net bridge | How much growth was absorbed by discounts and returns? |
| Channel contribution | Which selling channels created the movement? |
| Like-for-like view | How did the parts of the business present in both periods perform? |
| Constant-currency view | Did foreign-exchange movement distort reported growth? |
You do not need every layer for every comparison. Use only the ones required to explain the meaningful variance.
What If the Previous Period Was Zero?
Percentage change becomes unusable when the baseline is zero. Suppose a new Etsy store generated: Period A: $0, Period B: $15,000.
You cannot meaningfully say it grew by a conventional percentage. Use: +$15,000 contribution
Instead. The same rule applies to a newly launched product, market or sales channel. Absolute contribution is clearer than trying to force a percentage onto a zero baseline.
What If a Promotion Happened in Only One Period?
Do not remove the promotion from the data just because it complicates the comparison. It actually happened. First report the real sales result. Then create a second analytical view if necessary.
For example:
- Total current-period sales growth: +18%
- Sales from promoted products: +$24,000
- Non-promoted catalog sales: +2%
Now management understands both the full result and the dependence on the promotion. This is more useful than pretending the promotion never existed or calling all 18% "underlying growth."
How Many Drivers Do You Need to Explain?
You do not need to explain every dollar with dozens of tiny categories. Start with the largest positive and negative contributors. Suppose the sales variance is +$40,000 and five products explain +$36,000 of that movement.
Those products deserve attention first. Small residual changes can be grouped unless they are operationally important. The purpose of variance analysis is not to make the spreadsheet perfect. It is to identify the commercial forces that actually changed the result.
A Complete Worked Example
Imagine an ecommerce business moves from: Period A net sales: $300,000 to: Period B net sales: $342,000 The sales variance is: +$42,000, or +14% The store then investigates.
Order analysis shows that additional transaction volume contributed approximately +$30,000 while higher AOV contributed another +$12,000. Product contribution shows:
Existing Products A and B: +$21,000
New Product C: +$18,000
Product D: -$9,000
Remaining catalog: +$12,000
Total: +$42,000
Product D is then investigated and found to have been unavailable for part of the current period. Next, channel analysis shows:
Direct store: +$10,000
Amazon: +$27,000
eBay: +$5,000
Total: +$42,000
The same $42,000 is being explained through two different analytical dimensions. You do not add the product and channel figures together. You use them to build the story: Net sales increased $42,000. Higher order volume created most of the store-level improvement.
A newly launched product contributed significantly, while one existing product reduced growth because of weaker availability. Amazon generated most of the channel-level increase. That is a useful period comparison. "Sales were up 14%" is only the starting point.
Where Statty AI Fits
This type of analysis becomes harder when sales, orders, products, customers, inventory and channels sit in separate reports.
Statty AI is designed to help ecommerce businesses connect those signals across Shopify, WooCommerce, BigCommerce, Adobe Commerce, Wix, Squarespace, Ecwid, PrestaShop, Shopware, Amazon, Etsy, eBay and other or custom commerce environments.
The goal is not simply to show: This period: $342,000, Previous period: $300,000 The more useful outcome is helping merchants investigate which store signals sit behind the $42,000 difference.
You can explore Statty AI analytics features or visit Statty AI to learn more about its connected ecommerce intelligence approach. For the broader question of which metrics deserve attention across the store, see Ecommerce Metrics That Matter.
Final Thoughts
A good ecommerce sales comparison should reconcile a difference, not just display two numbers beside each other. Start with the exact sales variance. Then break it into order volume and order value.
Identify the products that added or removed the most sales. Separate existing products from new assortment. Go deeper into units and realized selling value where necessary. Show how discounts and returns changed gross sales into net sales.
Separate like-for-like growth from new stores or marketplaces. Normalize currency when exchange rates materially distort the comparison. And never add overlapping dimensions together as though the same revenue can be counted twice.
Once you work this way, the question changes from: Did sales increase or decrease? To: Exactly which parts of the business created the difference between these two periods? That is where a period comparison becomes genuinely useful for decision-making.