Your ecommerce website generated $90,000 last month.
Amazon generated $70,000.
Etsy generated another $22,000.
Which channel performed best?
Revenue alone cannot answer that question.
Your website may have generated fewer sales but stronger margins and richer customer data. Amazon may have produced greater product exposure but also higher marketplace and fulfillment costs. Etsy may have generated a smaller share of revenue while performing particularly well for a narrow group of products.
Even the traffic numbers are not automatically comparable. A Google Analytics session on your website, an Amazon session and an Etsy visit are defined inside different measurement systems. That is the challenge online retail analytics needs to solve.
The purpose is not to make every storefront and marketplace look identical. It is to identify which business outcomes can be compared fairly, keep channel-specific signals where they matter, and understand how each channel contributes to the overall ecommerce business.
What Is Online Retail Analytics?
Online retail analytics is the process of analyzing sales, customer, product, traffic, inventory and other performance information generated by digital retail channels.
For a single ecommerce website, that may involve website sessions, product views, add-to-cart activity, checkout progression, purchases, revenue, customers and inventory.
For a marketplace seller, the useful data can look different. Amazon may emphasize sessions, page views, ordered product sales, units and ASIN-level performance. Etsy provides visits, orders, conversion rate, revenue and listing-level performance. eBay Seller Hub combines sales, selling costs, traffic, listings and seller-performance information.
So a business operating across several channels needs two views at once.
The first asks: How is the ecommerce business performing overall?
The second asks: What is happening inside each individual channel?
Good retail ecommerce analytics should support both.
Why Can You Not Use Exactly the Same KPIs Everywhere?
Because the channels do not measure the shopping experience in exactly the same way.
An owned website gives the merchant much more control over the buying journey. With a properly configured analytics implementation, you can measure sessions, product views, add-to-cart events, checkout starts and completed purchases.
Google Analytics' Purchase journey report, for example, follows users from session start through product viewing, adding to cart, beginning checkout and purchase. A marketplace seller operates inside a different environment.
The marketplace controls much of the browsing, search, checkout and customer experience. Sellers receive the metrics that the marketplace makes available. That means the business question can stay the same while the available evidence changes.
You may want to know: "Are more shoppers becoming buyers?"
On an owned store, you might study website sessions and the full purchase funnel. On Etsy, you might use visits and conversion rate. On Amazon, sessions and unit session percentage can provide relevant sales-and-traffic context.
Those metrics are related. They are not necessarily identical.
Website Sessions and Marketplace Visits Need Context
Traffic is one of the easiest areas to compare incorrectly.
Google Analytics defines a session as a period during which a user interacts with a website or app. Ecommerce events can then record actions such as viewing products, adding items to a cart and purchasing.
Amazon uses its own reporting logic. Its Business Reports documentation defines a session around customer visits to Amazon product pages, with multiple page views possible within a session. Amazon also reports page views, units ordered, ordered product sales and unit session percentage.
Etsy defines a visit as a unique browsing session in a shop. Multiple listing views can happen during one visit. Etsy then reports orders, conversion rate, revenue and listing views separately.
So it would be risky to put: Google Analytics sessions, Amazon sessions & Etsy visits into one column and assume they represent perfectly interchangeable units of shopper demand. They can all provide traffic context, but they should usually retain their platform label and definition.
Compare Business Outcomes Before Comparing Platform Metrics
A better approach is to begin with outcomes that answer similar business questions. For example, most channels can tell you something about: sales, orders, units, product performance, refunds or returns, and inventory.
Those concepts may still require normalization, but they are closer to shared commercial outcomes than channel-specific traffic measures.
Suppose: Your website generates $100,000, Amazon generates $80,000 & Etsy generates $25,000. A useful company-level view might compare each channel's contribution to normalized sales.
Then, when you need to understand why a channel changed, move back into its native metrics.
For the website, investigate traffic and the purchase journey. For Amazon, investigate sessions, product or ASIN performance, ordered units and relevant marketplace signals. For Etsy, investigate visits, listing performance, conversion and orders.
The company view tells you where performance changed. The channel view helps you investigate why.
Orders Can Be Compared More Easily Than Traffic, But Definitions Still Matter
Orders look more standardized than traffic, but they still require care. One platform may record an order when it is created. Another report may include only certain paid or commercially valid transactions. Canceled, refunded or pending orders can also affect totals differently.
This is why your overall reporting framework should define what counts as an eligible order before channels are combined. For example: Eligible company order = a completed or commercially valid transaction that meets the business's agreed reporting rules.
Each platform's native order states can then be mapped to that business definition. If this process is not completed first, order-count comparisons can look precise while measuring slightly different things.
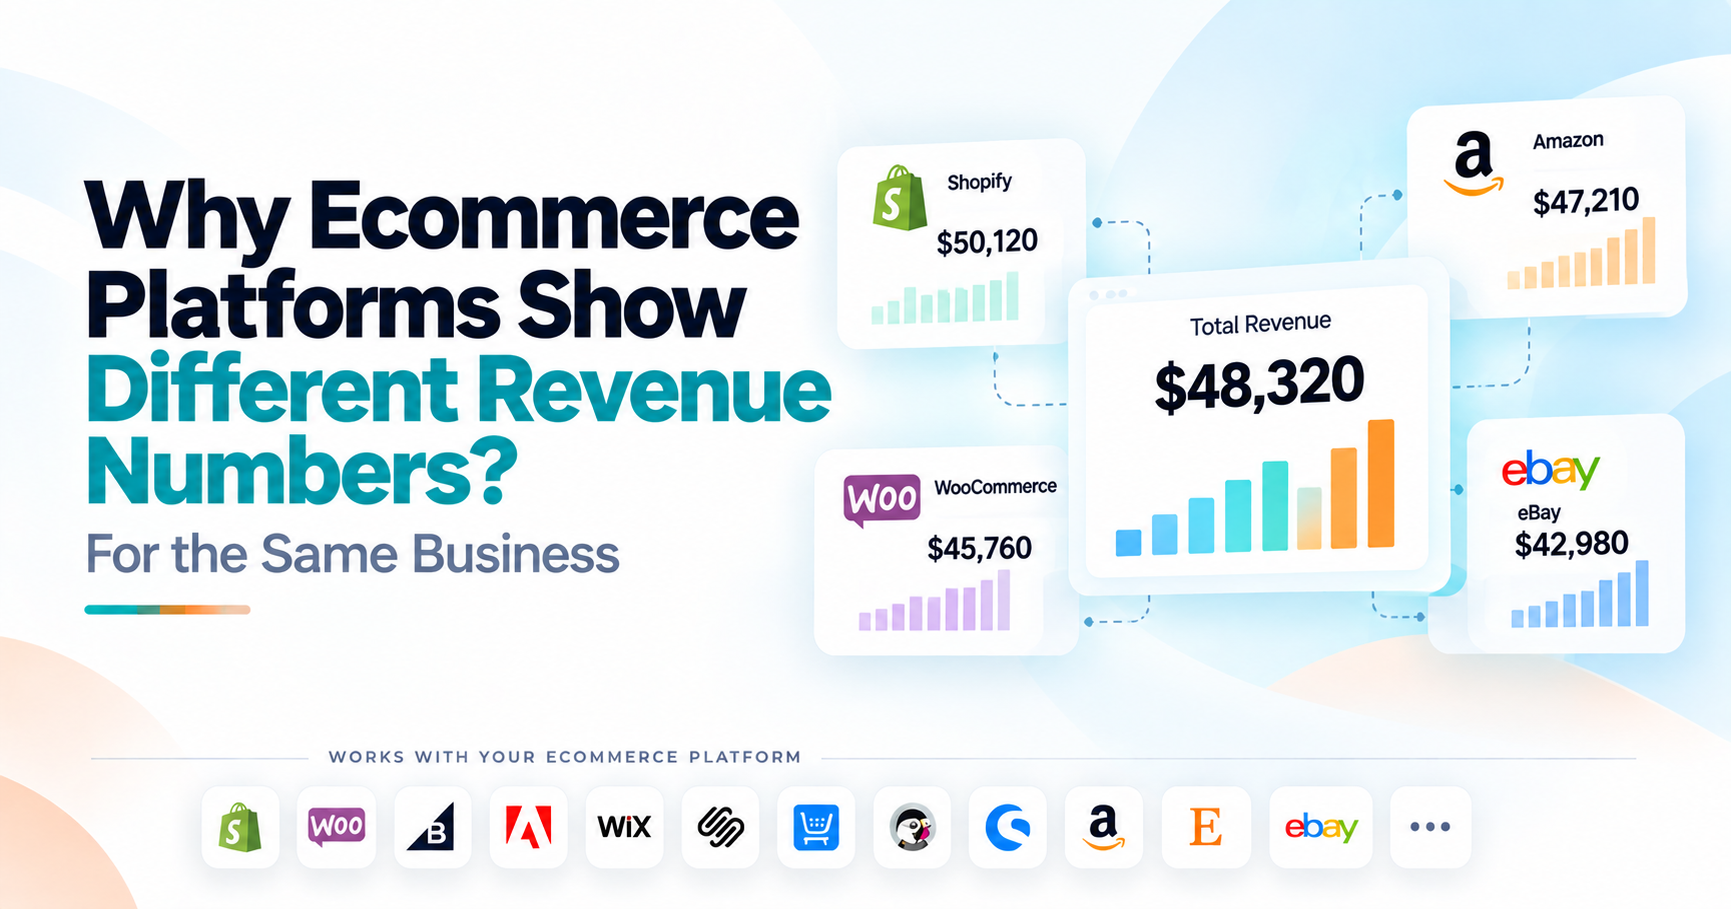
The related guide Why Ecommerce Platforms Show Different Revenue Numbers for the Same Business explains the same problem in greater depth for revenue, refunds, taxes, shipping and transaction timing.
Revenue Contribution Is One of the Most Useful Cross-Channel Views
One practical multichannel metric is channel contribution to total normalized sales. Suppose normalized ecommerce revenue is $250,000:
Your website contributes $125,000.
Amazon contributes $90,000.
Etsy contributes $35,000.
The website contributes 50% of sales.
Amazon contributes 36%.
Etsy contributes 14%.
That gives management a clear business-level view. But contribution becomes more useful when you track how it changes.
If Amazon's share moves from 22% to 36%, ask whether Amazon genuinely grew, the website weakened, or both happened simultaneously. A percentage by itself cannot answer that. Always review both absolute sales and channel share.
Channel Growth and Business Growth Are Not the Same Thing
Imagine Amazon grows 30%. That sounds strong. But if Amazon represents only 8% of company revenue, its effect on total business growth may still be modest.
Now imagine your owned store grows 6% but represents 65% of company revenue. That smaller percentage change may contribute far more incremental revenue.
This is why ecommerce performance analytics should consider both: how fast the channel changed, and how important the channel is to the business.
A rapidly growing small channel and a slowly growing large channel can both be strategically important for different reasons.
Product Performance Should Be Read Across Channels and Within Channels
Products create another useful bridge between storefront and marketplace analytics.
Suppose Product A performs strongly on Amazon but poorly on your website.
That does not automatically mean one channel is better.
Amazon shoppers may discover the category differently.
Competition may differ.
Pricing may differ.
Marketplace reviews may strengthen purchase confidence.
Your website may attract a different customer mix.
The useful question is: Why does this product perform differently by channel?
For Amazon, product analysis often happens around ASIN-level information. Amazon Business Reports can provide sales and traffic detail by ASIN, including ordered product sales, units ordered, sessions, page views and related performance measures.
Etsy takes a listing-oriented approach. Etsy Stats lets merchants review listing views, favorites, orders and revenue for individual listings.
An owned ecommerce store may instead connect product performance with product-page views, cart activity, checkout and customer information. The product is the common business object. The diagnostic metrics around it remain channel-specific.
Listing Metrics Do Not Need a Website Equivalent
One common mistake in marketplace analytics is trying to translate every marketplace metric into a website metric. You do not need to do that.
An Etsy listing view can remain an Etsy listing view.
Amazon Featured Offer percentage can remain an Amazon marketplace metric.
eBay seller-level or selling-cost information can remain specific to eBay.
eBay Seller Hub, for example, currently provides Performance reporting around sales, selling costs, traffic, buyer traffic sources and seller-level information, together with listing and payment tools.
These signals may have no exact counterpart on your own website. That does not make them less useful. It simply means they belong in the channel diagnostic layer rather than the standardized company KPI layer.
Customer Analytics Is Often Richer on an Owned Store
Customer information is another major difference between storefronts and marketplaces. An owned ecommerce environment can often support deeper customer analysis because the merchant controls more of the first-party relationship.
You may be able to analyze: first-time versus returning customers, purchase frequency, customer segments, cohorts, repeat revenue, and longer-term customer behavior.
Marketplace customer information can be more restricted or structured differently because the marketplace controls more of the transaction and customer experience.
That means it can be misleading to compare a sophisticated website retention metric directly with a marketplace customer measure that was built from less complete customer identity data.
When cross-channel customer identity cannot be established reliably, keep the channel-level customer views separate.
For the wider framework around customer value and repeat behavior, see Ecommerce Customer Analytics: Who Buys, Who Returns and Who Actually Drives Revenue?.
Do Not Compare Conversion Rates Without Reading the Denominator
Conversion rate is another metric that looks universal but often is not. On an owned website, conversion might be calculated from ecommerce purchases divided by website sessions or users, depending on the reporting method.
Etsy defines shop conversion rate as the percentage of visits that result in an order. Amazon Business Reports include measures based on sessions and ordered units or order items, with definitions specific to Amazon's environment.
Those rates can all help evaluate purchasing efficiency. But putting them side by side as though they came from one measurement system can be misleading.
Before comparing any percentage, ask: What exactly is the numerator? And What exactly is the denominator?
If those definitions differ materially, compare each channel against its own historical baseline instead of declaring one channel's conversion rate "better."
Compare Channels Against Themselves Before Ranking Them Against Each Other
This is one of the most useful principles in marketplace analytics.
Instead of beginning with: "Amazon conversion is higher than website conversion, so Amazon performs better."
begin with: "Is Amazon improving relative to Amazon's own historical performance?"
And: "Is the website improving relative to the website's own comparable baseline?"
This reduces false comparisons. A channel can be healthy even if its native conversion metric is lower than another channel's because its traffic, purchase process and measurement methodology are different. Trend quality often tells you more than a raw cross-channel ranking.
Sales Contribution Is Not Profit Contribution
A channel that generates the most revenue is not automatically the channel creating the strongest financial result. Consider two channels:
Channel A produces $100,000 in sales.
Channel B produces $80,000.
Channel A may also carry greater marketplace fees, advertising expense, fulfillment expense, returns or shipping costs.
Channel B may generate less revenue but retain more money after the costs associated with producing those sales.
eBay's current Seller Hub reflects this distinction by reporting sales alongside selling costs such as eBay fees and shipping-label costs. This is why online retail analytics should keep revenue and profitability conceptually separate.
Revenue answers: How much did we sell?
Profitability asks: How much economic value remained after the relevant costs?
They are related but not interchangeable.
What Should Be Included in Channel Profitability?
The answer depends on the level of profit you are measuring.
For a useful channel contribution view, businesses may consider costs such as product cost, marketplace fees, payment fees, fulfillment, shipping subsidies, advertising and returns where reliable data is available.
But do not call a number "profit" unless the calculation includes the costs your organization expects that term to represent.
If advertising cost is missing, say so. If product cost is incomplete, label the metric appropriately.
A precise-looking margin based on incomplete cost data can be more misleading than a clearly defined revenue metric.
The objective is not to force perfect profitability accounting into every analytics dashboard. It is to prevent revenue share from being mistaken for economic contribution.
Inventory Performance Can Also Differ by Channel
A product can sell strongly overall while experiencing channel-specific availability problems. Suppose the same item sells through your website and Amazon. Website inventory remains available. Amazon inventory becomes constrained.
Total product sales may look stable because the website compensates for the marketplace decline.
At company level, nothing appears wrong.
At channel level, an operational problem exists.
This is why product and inventory views should support both consolidated and channel-specific analysis.
Ask: Is the product healthy overall?
Then: Is it equally available in every important channel?
The second question can expose problems hidden by the first.
A Strong Multichannel View Uses Two Layers
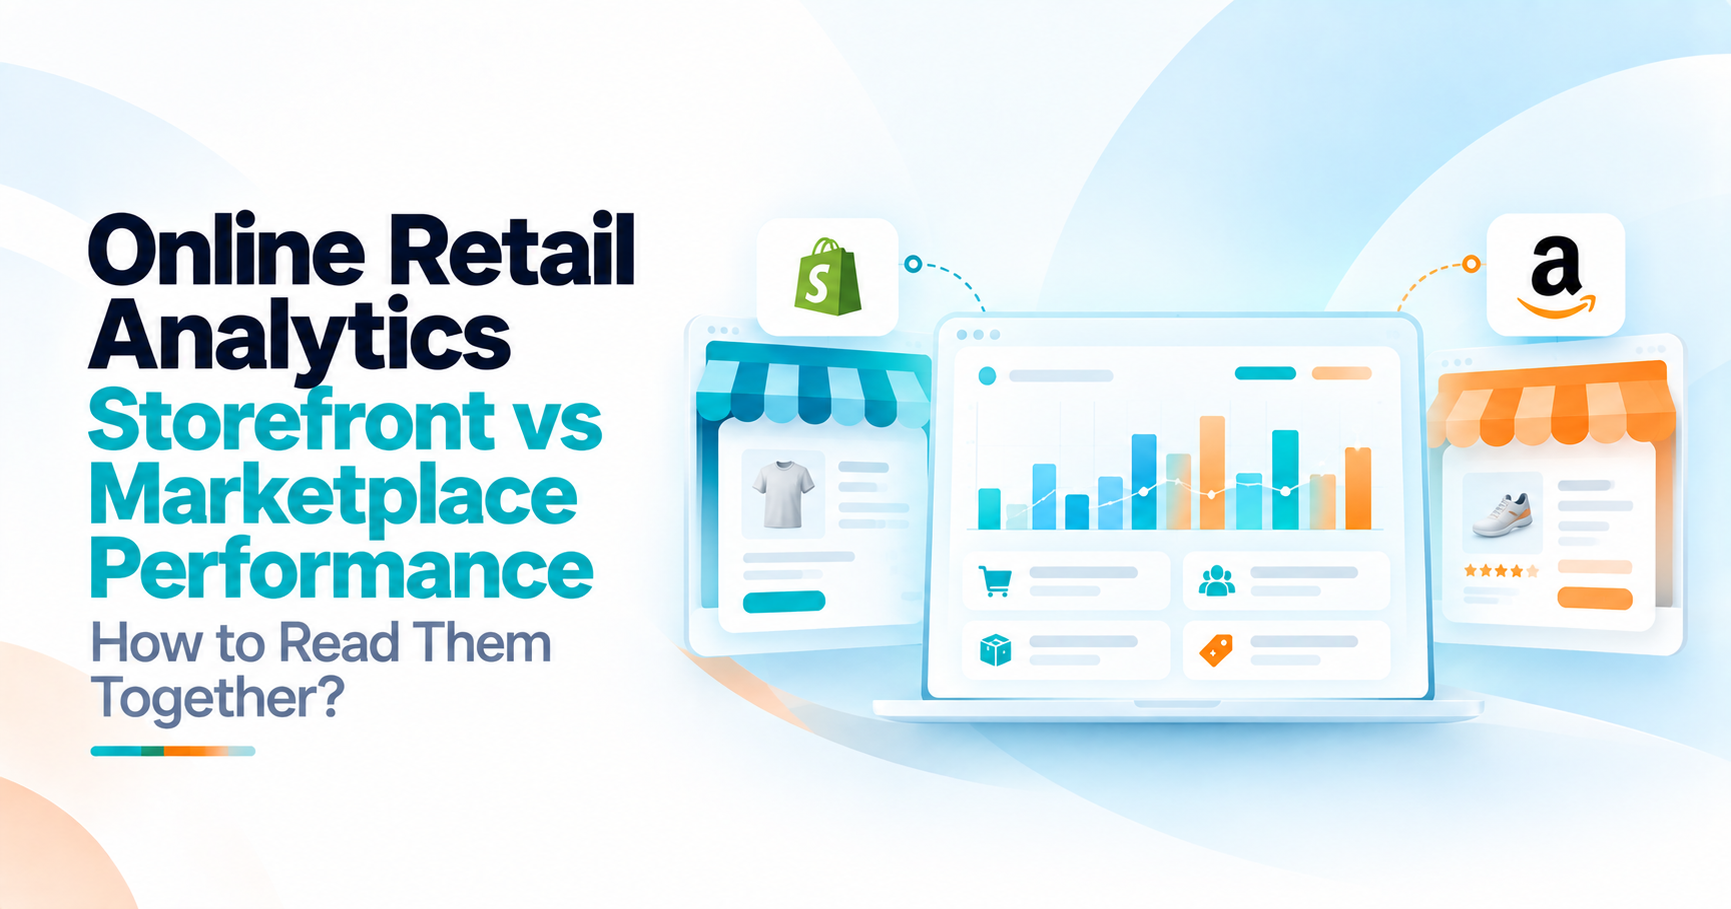
The cleanest way to organize online store analytics and marketplace analytics together is to separate business-level measures from channel diagnostics.
At the business level, you may want consistent views of normalized sales, eligible orders, units, product contribution, refunds and channel contribution where those measures can be mapped reliably.
At the channel level, preserve the native metrics needed to investigate each environment.
For an owned website, that might include sessions and purchase-funnel behavior.
For Amazon, it might include sessions, page views, ASIN performance and marketplace-specific indicators.
For Etsy, visits, listing views, favorites, orders and conversion may be useful.
For eBay, sales, selling costs, traffic, listings and seller-performance information can remain visible.
This gives management one company view without removing the metrics specialists need.
What Should an Online Retail Performance Review Actually Ask?
A useful review begins with the business outcome. Did overall ecommerce sales increase or decrease?
Then determine which channels contributed to that movement. Next, investigate the channels with meaningful changes using their own relevant metrics.
If website sales fell, examine website traffic, product engagement and the buying funnel.
If Amazon sales weakened, inspect Amazon sales, sessions, units and product-level signals.
If Etsy improved, identify which listings and traffic sources contributed.
Then add commercial context.
Did the channel's share of revenue change?
Did returns or costs change?
Was product availability healthy?
Did the improvement translate into stronger profitability, or only higher gross sales?
That sequence is far more useful than forcing twenty identical KPI columns across every channel.
Keep Attribution Separate From Channel Sales Unless the Data Supports the Connection
Another common mistake is treating the channel where a purchase occurred as the only channel responsible for creating demand.
A customer may discover your brand through your website, later search on Amazon and purchase there.
Another customer may first discover the product on a marketplace and later buy directly from your website.
The sales channel tells you where the transaction happened. It does not always tell you where demand originated.
Advanced attribution can help analyze these relationships, but do not invent cross-channel attribution when the required identity and journey data is unavailable.
For ordinary retail analytics, keep the distinction clear:
Transaction channel: where the order occurred.
Acquisition or influence: which interactions may have contributed to the purchase.
Those questions require different data.
Where Statty AI Fits
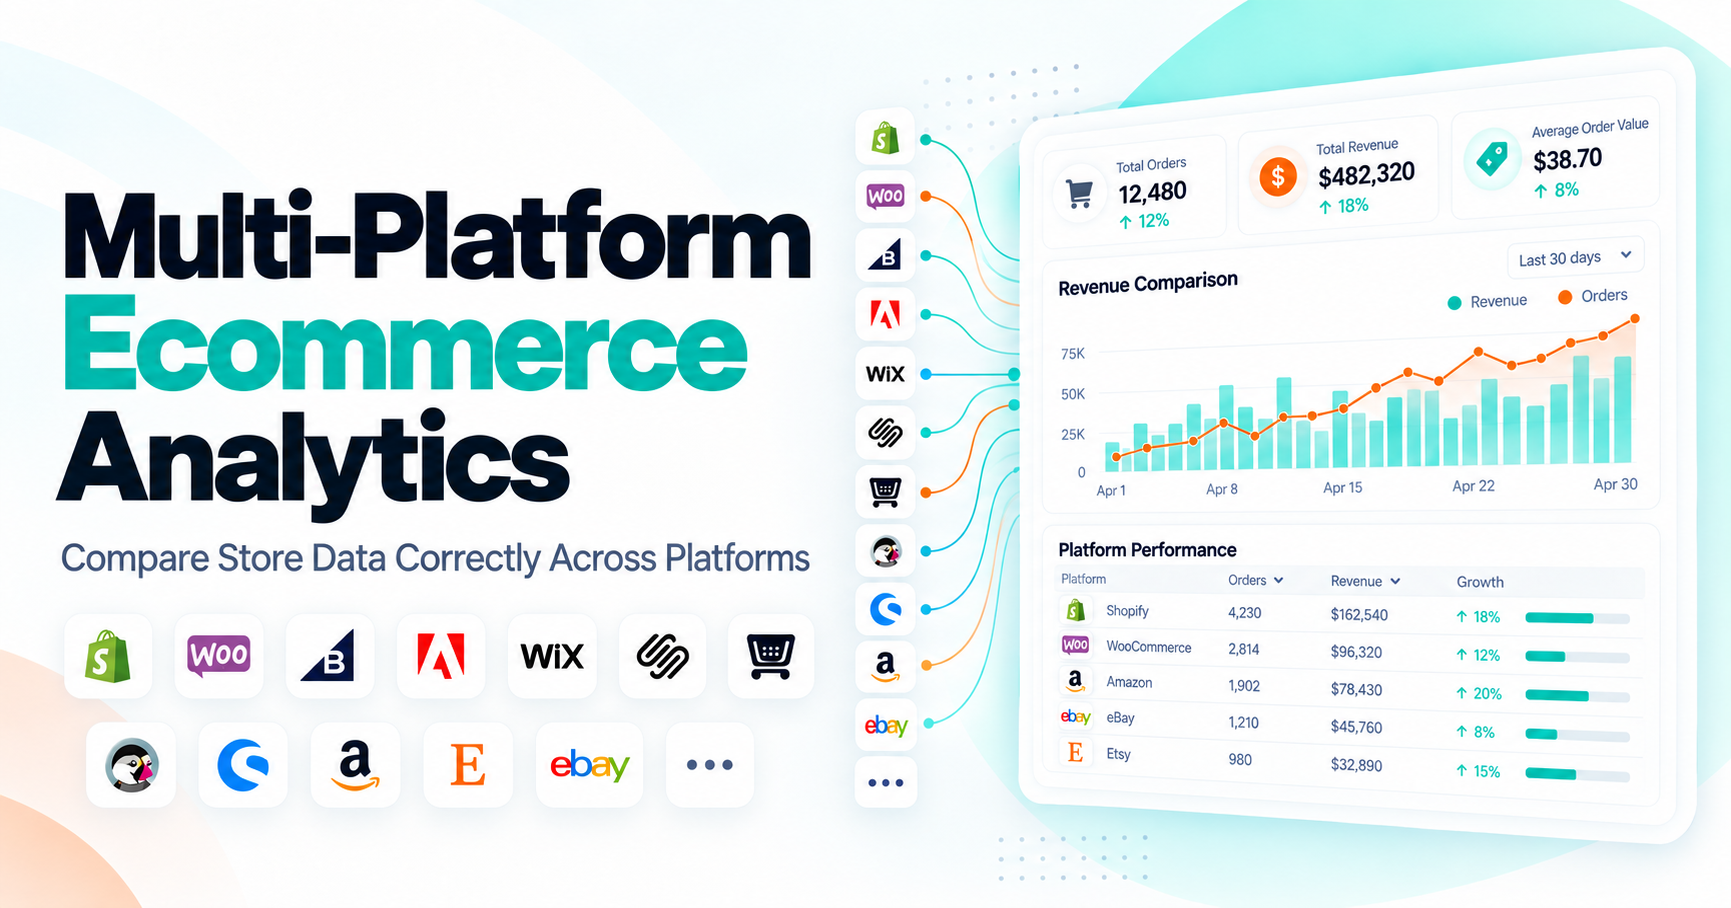
Statty AI's updated strategy is built around broader ecommerce analytics rather than a Shopify-only model. The platform direction includes Shopify, WooCommerce, BigCommerce and additional stores and marketplaces such as Adobe Commerce, Wix, Squarespace, Ecwid, PrestaShop, Shopware, Amazon, Etsy and eBay, while recognizing that each environment exposes different data and should not be described with identical metrics.
That platform-specific approach matters here. Statty AI's current strategy explicitly recommends Amazon language around ordered sales, units, product or ASIN performance and inventory; Etsy language around visits, orders, revenue, conversion and listing performance; and eBay language around sales, costs, traffic and listing performance.
Current connector availability is also different by platform. Shopify, WooCommerce and BigCommerce are currently shown as ready, while several other storefront and marketplace connections are shown as upcoming or available through request-access paths.
Merchants should therefore check Statty AI Integrations for the current availability of the channel they use. You can also review Statty AI Features for the broader analytics capabilities.
One limitation should remain explicit: Statty AI should not be described as already providing fully unified simultaneous aggregation across every store and marketplace unless that exact capability has been confirmed.
The principles in this article explain how storefront and marketplace performance should be interpreted together, not a claim that every cross-channel function described here is already live.
Final Thoughts
Online retail analytics becomes harder when a business grows beyond one storefront, but the solution is not to force every platform into the same dashboard template. Begin with the business outcomes that can be compared fairly.
Revenue.
Orders.
Units.
Product contribution.
Refunds.
Channel contribution.
Then preserve the native metrics that explain what is happening inside each environment.
A website session is not automatically the same thing as an Etsy visit.
An Amazon product-performance metric does not need a Shopify equivalent.
Marketplace customer information may not support the same retention analysis as an owned store.
A channel producing the most revenue may not produce the strongest profit.
The right approach is therefore:
Standardize the business outcome where the data supports itPreserve the channel-specific diagnostic metrics where differences matter.
That lets you answer the question that matters most: How is the ecommerce business performing overall, which channel is creating the change, and what does that channel's own data tell us about why?
That is a much more useful goal for online retail analytics than trying to make every storefront and marketplace look the same.
FAQ
What is online retail analytics?
Online retail analytics is the analysis of sales, products, customers, traffic, inventory and other performance information from digital retail channels. It can include owned ecommerce websites, marketplaces and multiple online storefronts.
Can website sessions and marketplace visits be compared directly?
Not always. Google Analytics sessions, Amazon sessions and Etsy visits are defined within different measurement environments. They can all provide traffic context, but merchants should understand each definition before comparing them directly. Etsy, for example, defines a visit as a unique browsing session in a shop.
What metrics can usually be compared across ecommerce channels?
Sales, eligible orders, units, product contribution and refunds can often be compared when their definitions have been normalized correctly. Channel-specific traffic, conversion, customer and marketplace-performance measures usually require more care.
Should Amazon conversion rate be compared directly with website conversion rate?
Not automatically. Amazon and website analytics can use different traffic and purchase definitions. The safer approach is to understand each calculation and compare the channel with its own historical performance before making direct rankings.
What should I track for Amazon marketplace performance?
Useful Amazon seller metrics can include ordered product sales, units ordered, sessions, page views, product or ASIN performance and relevant marketplace indicators. Amazon Business Reports currently provides sales and traffic information at date and ASIN levels.
What should I track for Etsy performance?
Etsy Stats currently includes visits, orders, conversion rate, revenue and listing-level measures such as views, favorites, orders and revenue. Those metrics should be interpreted within Etsy's own marketplace environment rather than forced into a direct-store reporting model.
Does the channel with the most revenue always perform best?
No. Revenue does not include all relevant costs. Marketplace fees, advertising, fulfillment, product costs, shipping and returns can make a lower-revenue channel more profitable than a higher-revenue one.
Should marketplace and storefront customer analytics be combined?
Only when customer identity and data definitions are reliable enough to support it. Owned stores can often provide richer first-party customer history, while marketplaces may expose less customer-level information. If identity cannot be matched reliably, keep the customer views separate.
What is the best way to build a multichannel ecommerce dashboard?
Use two levels. The first should contain normalized business-level metrics that can be compared fairly across channels. The second should retain platform-specific diagnostic metrics for investigating each storefront or marketplace. This preserves both comparability and context.