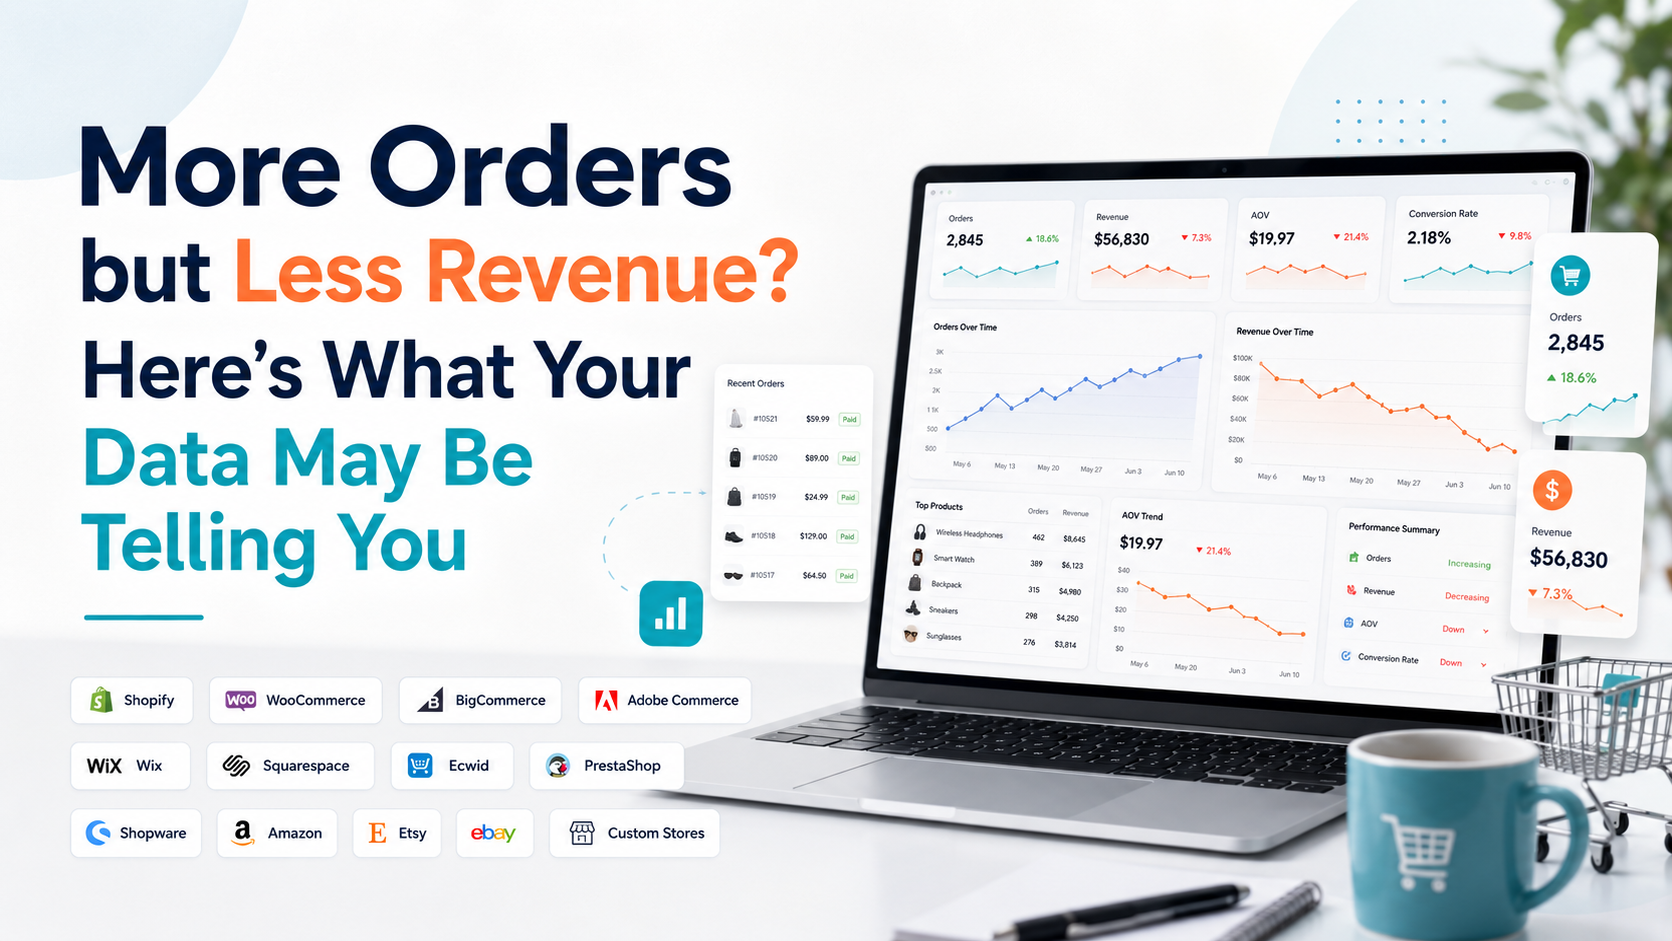
Your WooCommerce store reports $60,000 in gross sales, but net sales show only $46,000. Orders are increasing, yet the revenue you retain after discounts and returns is barely improving.
Is something wrong with your WooCommerce revenue report? Not necessarily.
Gross sales, net sales and total sales measure different parts of your store's performance. Coupons, refunds, taxes and shipping charges can create substantial differences between them. Understanding those differences matters when deciding whether to increase advertising, continue a promotion, adjust pricing or invest in better reporting software.
WooCommerce already provides detailed revenue reporting. The challenge for growing stores is often connecting those figures with orders, products, customers and inventory to understand what actually changed.
This guide explains how to evaluate your WooCommerce revenue analytics, identify the reasons behind revenue changes and decide when a dedicated analytics solution could help.
Which WooCommerce Revenue Metric Should You Use to Evaluate Store Performance?
Net sales are usually the most useful starting point for evaluating WooCommerce product revenue because they account for coupons and returns. Gross sales help measure sales activity before those adjustments, while total sales include taxes and shipping.
According to WooCommerce's official analytics documentation, the calculations are:
Gross Sales = Product Selling Price × Quantity Sold
Net Sales = Gross Sales − Returns − Coupons
Total Sales = Net Sales + Taxes + Shipping
Each metric serves a different purpose. The best WooCommerce sales dashboard should let you understand all three without treating them as interchangeable.
For example, gross sales can help evaluate demand during a promotional campaign. Net sales can show how much product revenue remains after discounts and refunds. Total sales provides a broader measure of the transaction amounts recorded, including customer-paid shipping and taxes.
However, total sales should not be confused with profit or the amount deposited into your bank account. Payment fees, operating expenses and other costs are separate considerations.
If you regularly make pricing, inventory or marketing decisions using only one headline revenue number, your reporting may be missing important context.
Gross Sales vs Net Sales vs Total Sales: What the Numbers Mean
Consider a WooCommerce store with the following results during a reporting period:
- Gross sales: $60,000
- Coupon discounts: $9,000
- Returns: $5,000
- Taxes: $4,200
- Shipping charged to customers: $2,400
Its net sales would be $46,000 after subtracting coupons and returns. Adding taxes and shipping produces total sales of $52,600.
These amounts are illustrative, but they show why a merchant can see several different revenue figures for the same reporting period.
The store generated $60,000 in product sales before adjustments, but $14,000 was deducted through discounts and returns. That distinction matters when evaluating campaign performance or investigating a change in revenue.
A merchant considering another discount campaign should investigate whether the previous campaign produced sufficient additional net sales, rather than judging success purely by gross sales.
Similarly, a merchant reviewing a revenue decline should check whether orders decreased or whether a larger portion of product sales was lost to discounts and refunds. The commercial question is not simply how much you sold. It is how much revenue those sales generated after the relevant adjustments.
How Do WooCommerce Coupons Affect Revenue Analytics?
WooCommerce coupons reduce net sales, but a higher discount total does not automatically mean a promotion performed poorly.
A promotion might generate more orders, introduce new customers or help sell slower-moving inventory. However, it might also increase sales volume without producing a meaningful improvement in revenue after discounts.
Suppose a store generates $40,000 in gross sales with $2,000 in coupon discounts during one period. During a later promotion, gross sales increase to $48,000, but coupon discounts reach $9,000.
Before accounting for returns, the amount remaining after coupons decreases from $38,000 to $39,000. Gross sales increased by 20%, while revenue after coupon discounts increased by only about 2.6%. That difference changes how the promotion should be evaluated.
WooCommerce's Coupons report allows merchants to review coupon usage and discount amounts. When reviewing promotions, compare coupon-related reductions with order volume, average order value, product performance and the purpose of the campaign.
A dedicated WooCommerce sales analytics solution becomes useful when you frequently need to examine these relationships rather than interpreting coupon totals independently.
How Do Returns and Refunds Affect WooCommerce Revenue?
WooCommerce refunds reduce reported revenue, and their timing can change which reporting period shows the reduction.
WooCommerce Analytics records refunds as negative amounts on the date the refund occurs, rather than automatically assigning them to the date of the original order. For example, a customer purchases a $300 product on September 28 and receives a refund on October 5.
The original sale can contribute to September's revenue, while the refund creates a negative adjustment in October. As a result, October's net sales may decrease even though the original purchase happened in September.
This is important when comparing monthly results. A revenue decline may partly reflect refunds for earlier purchases rather than a sudden reduction in new customer demand.
WooCommerce also distinguishes refunded product or service amounts from refunded shipping and taxes in its analytics calculations. Its Revenue report documents additional treatment for fully refunded orders, so merchants should check the applicable reporting breakdown when reconciling individual transactions.
The distinction between a return and a refund also matters. The WooCommerce Returns metric represents refunded product or service value, including cases where goods were not physically returned.
For business decisions, examine refund amounts alongside the affected products, original orders and refund dates. A rising refund total may justify reviewing product descriptions, customer expectations, product quality or fulfillment experiences, but the sales figure alone does not establish the cause.
A WooCommerce analytics platform should help merchants investigate these relationships without suggesting explanations that the available data cannot support.
Why Does Your WooCommerce Sales Dashboard Show Different Revenue Totals?
Different revenue totals do not always indicate an error. WooCommerce dashboards, revenue reports, payment records and exported orders may use different calculations, dates or inclusion rules.
Before replacing your WooCommerce reporting plugin or assuming that transactions are missing, check the following areas.
- Revenue Definitions and Included Charges
The first thing to confirm is whether the figures represent gross sales, net sales or total sales.
A net-sales figure excludes taxes and shipping, while a total-sales figure adds them. Comparing those two values directly will naturally produce a difference.
Payment reports may also reflect transaction fees or payout timing that are outside the scope of standard WooCommerce revenue calculations.
- Order Dates and Order Statuses
WooCommerce allows merchants to select which date field revenue and order reports should use, including order creation, payment and completion dates. Its documented default is Date Paid.
An order created on Monday but paid on Tuesday can therefore appear in different daily periods depending on the configuration.
Order-status settings also influence which transactions qualify for reporting. Before comparing two WooCommerce revenue reports, make sure the relevant statuses and date rules are consistent.
- Refund Dates and Partial Refunds
A refund processed during the current month can affect revenue even when its original order was placed earlier.
Partial refunds also need attention because they reverse only part of an order's value. When investigating a discrepancy, review the individual refund records instead of assuming every refunded order was fully reversed.
- Analytics Data Updates
WooCommerce processes and caches analytics data. Depending on the site's settings, reporting data may not update at the same moment as the underlying order records.
WooCommerce 10.5 introduced additional analytics update controls, including scheduled processing and an immediate update option.
If your WooCommerce revenue report appears outdated, check the analytics data status, update settings and cache before concluding that another reporting system is required.
For stores using several ecommerce systems, the issue can become more complicated because each platform may define revenue differently. Our earlier guide, Why Ecommerce Platforms Show Different Revenue Numbers, explains how to assess those differences.
How to Compare WooCommerce Revenue Between Two Periods
A useful WooCommerce revenue comparison should show more than whether sales increased or decreased. It should explain which changes contributed to the result. Consider two equivalent reporting periods.
During Period A, a store generates $50,000 in gross sales, gives $3,000 in coupon discounts and records $2,000 in returns. Net sales equal $45,000.
During Period B, gross sales increase to $60,000, coupon discounts reach $9,000 and returns rise to $5,000. Net sales equal $46,000.
Gross sales increased by 20%, but net sales improved by only about 2.2%. That is a very different result from the growth suggested by the headline sales figure.
Before deciding to expand the promotion, the merchant should investigate whether additional orders came primarily from discounted purchases, whether the product mix changed and whether returns increased for particular items.
The next step is to review WooCommerce order analytics and average order value. WooCommerce calculates AOV using net sales divided by orders. If order volume increases while AOV falls, a change in purchasing behavior, product mix or discounting may help explain the result.
Product and inventory data can also provide useful context. A decline in a high-value product's sales may reflect limited stock rather than declining demand.
When comparing performance, use equivalent periods and consistent reporting settings. A complete seven-day period should not be compared directly with an unfinished seven-day period. For a more detailed approach, see How to Compare Store Performance Between Two Periods.
When Is WooCommerce's Built-In Revenue Report Enough?
WooCommerce's native analytics can be sufficient when your reporting requirements are straightforward and your team can investigate performance changes efficiently.
Its existing tools provide revenue and order reports, product and customer information, coupon analysis, date comparisons, filters and CSV exports.
If you operate one store, review a manageable number of products and only need periodic revenue reports, native WooCommerce Analytics may already meet your requirements.
The decision changes when your team repeatedly spends time moving between reports, exporting data or manually identifying relationships between revenue and other performance indicators.
For example, a WooCommerce store might experience a revenue decline despite stable order volume. Understanding that change may require comparing AOV, discounts, products, stock availability, customer behavior and refunds.
Native reporting can provide much of the underlying information, but the merchant still needs to bring the relevant findings together. That is where evaluating additional WooCommerce analytics software can make sense.
What Should You Look for in WooCommerce Revenue Analytics Software?
Choosing a WooCommerce reporting tool should begin with the decisions you need to make, not the number of charts advertised.
- Accurate revenue definitions should be the first requirement. The software must explain how it handles gross sales, net sales, total sales, discounts and refunds. It should also make its date and order-status treatment clear.
- Useful period comparisons are equally important. Merchants should be able to investigate changes across comparable dates and understand whether revenue movement reflects order volume, customer spending or other available factors.
- Connected product and customer analysis can provide more value than isolated revenue reports. When a store's net sales decline, reviewing product performance, customer purchasing patterns and inventory availability may help determine where to investigate next.
- Refund and coupon visibility should also influence the decision. Merchants running frequent promotions or processing substantial refunds need to see how those adjustments affect sales performance.
- Clear explanations and practical reporting can reduce the time spent interpreting multiple dashboards. If a product includes AI-assisted analysis, evaluate whether its explanations are grounded in your actual WooCommerce data and whether you can inspect the supporting metrics.
Finally, review the integration's data permissions, available historical information, update frequency, pricing and plan limitations before committing.
The most suitable WooCommerce analytics software is not necessarily the one with the most features. It is the one that answers your recurring business questions reliably and reduces unnecessary reporting work.
How Statty AI Helps WooCommerce Merchants Understand Revenue Changes
Statty AI is an AI-powered ecommerce analytics platform designed to help merchants understand available sales, customer, product, inventory and operational data through clearer reporting and AI-assisted explanations.
For WooCommerce merchants, its positioning focuses on connecting relevant store information and making changes easier to investigate.
Instead of reviewing a revenue decline without context, merchants can use supported analytics to examine related information, such as order volume, average order value, product sales and inventory availability.
Statty AI also emphasizes plain-English explanations and follow-up questions grounded in connected commerce data. This approach is intended to help merchants investigate business questions rather than manually interpreting every report.
For example, a merchant investigating weaker revenue could explore which products contributed most to the change or whether a shift in order value affected the overall result, subject to the data available through the WooCommerce connection.
Statty AI does not replace the need for accurate WooCommerce records or sound business judgment. Its value lies in making available commerce information easier to review and interpret.
You can explore its ecommerce analytics features or review the WooCommerce connection through Statty AI's integrations page to assess whether its supported capabilities match your reporting requirements.
Should You Choose Native WooCommerce Reports or an AI Analytics Platform?
If you mainly need to check gross sales, net sales, coupons, shipping and refunds, WooCommerce's built-in Revenue report is a reasonable starting point.
If you regularly need to understand why those figures changed, how other store metrics contributed and which issues deserve attention first, a dedicated ecommerce analytics platform may offer additional value.
Before purchasing, test the software against a real reporting question from your store. For example: "Net sales decreased last month even though order volume remained stable. Can the software help me investigate which available metrics explain the difference?"
A useful platform should make the investigation clearer, show relevant supporting data and acknowledge when the connected information is insufficient to establish a cause.
That is a more meaningful evaluation than choosing a product based solely on attractive dashboard screenshots. For additional guidance, read WooCommerce Analytics: Which Numbers Should Store Owners Check First?.
Frequently Asked Questions
What is the difference between gross sales, net sales and total sales in WooCommerce?
Gross sales represent product sales before returns and coupons, net sales subtract those adjustments, and total sales adds taxes and shipping. These are the definitions WooCommerce uses in its Analytics reports. Net sales are generally more relevant for evaluating product revenue after discounts and returns.
Why does my WooCommerce revenue report not match my total orders?
WooCommerce revenue and order counts measure different things, so they should not be expected to match directly. Revenue reflects monetary values and applicable adjustments, while order counts reflect qualifying transactions. Refund dates, coupons, order statuses, date settings and taxes can also influence comparisons between WooCommerce reports.
Does WooCommerce subtract refunds from net sales?
Yes. WooCommerce net sales account for returns, including refunded product or service value. Refunds are generally reported on the date they occur, which means a refund processed this month may reduce this month's reported results even when the original order was placed earlier.
How do coupons affect WooCommerce sales analytics?
Coupons reduce WooCommerce net sales by the relevant discount amount. A promotion can increase gross sales and order volume while producing a smaller improvement in net sales. Merchants should compare coupon usage with orders, AOV and product performance before deciding whether to repeat a promotion.
What is the best WooCommerce revenue analytics software?
The best WooCommerce revenue analytics software is the one that reliably answers your store's reporting and decision-making needs. Native WooCommerce Analytics may be enough for standard reporting. Dedicated solutions such as Statty AI are worth evaluating when you need connected performance analysis, AI-assisted explanations or a clearer way to investigate changes in sales and related metrics.
Can AI help explain why WooCommerce revenue dropped?
Yes, AI-assisted ecommerce analytics can help investigate possible reasons for a revenue decline when relevant store data is available. Useful analysis may examine orders, average order value, discounts, refunds, product performance and stock availability. However, an AI explanation should be supported by the connected data rather than treated as proof of a cause.
Do I need a separate WooCommerce sales dashboard?
Not necessarily. WooCommerce already includes a customizable dashboard and detailed revenue reports. A separate analytics platform becomes more useful when existing reporting requires frequent manual comparisons or when you need clearer relationships between sales, customer, product and inventory performance.
Can Statty AI connect to my WooCommerce store?
Yes. Statty AI lists WooCommerce among its supported ecommerce integrations. It is designed to analyze available WooCommerce revenue, orders, customers, products, inventory and other supported commerce information. The exact metrics depend on the connection and permissions available. Review the Statty AI integrations page for connection details.
Make Better Revenue Decisions With the Right WooCommerce Analytics
WooCommerce revenue reporting already provides the information needed to distinguish gross sales, net sales, returns, coupons, taxes, shipping and total sales. The next challenge is using those figures to make better commercial decisions.
A successful promotion should be evaluated against the revenue it produces after relevant adjustments. A revenue decline should be investigated alongside orders, products and inventory. Rising refunds should lead to a closer review of the underlying transactions and affected products.
If native WooCommerce reports already support those decisions efficiently, additional software may not be necessary.
But if you are repeatedly switching between dashboards and spreadsheets to understand revenue changes, a dedicated analytics platform is worth considering. Explore Statty AI and see how connected ecommerce analytics and AI-assisted explanations can help you understand your WooCommerce store's performance.