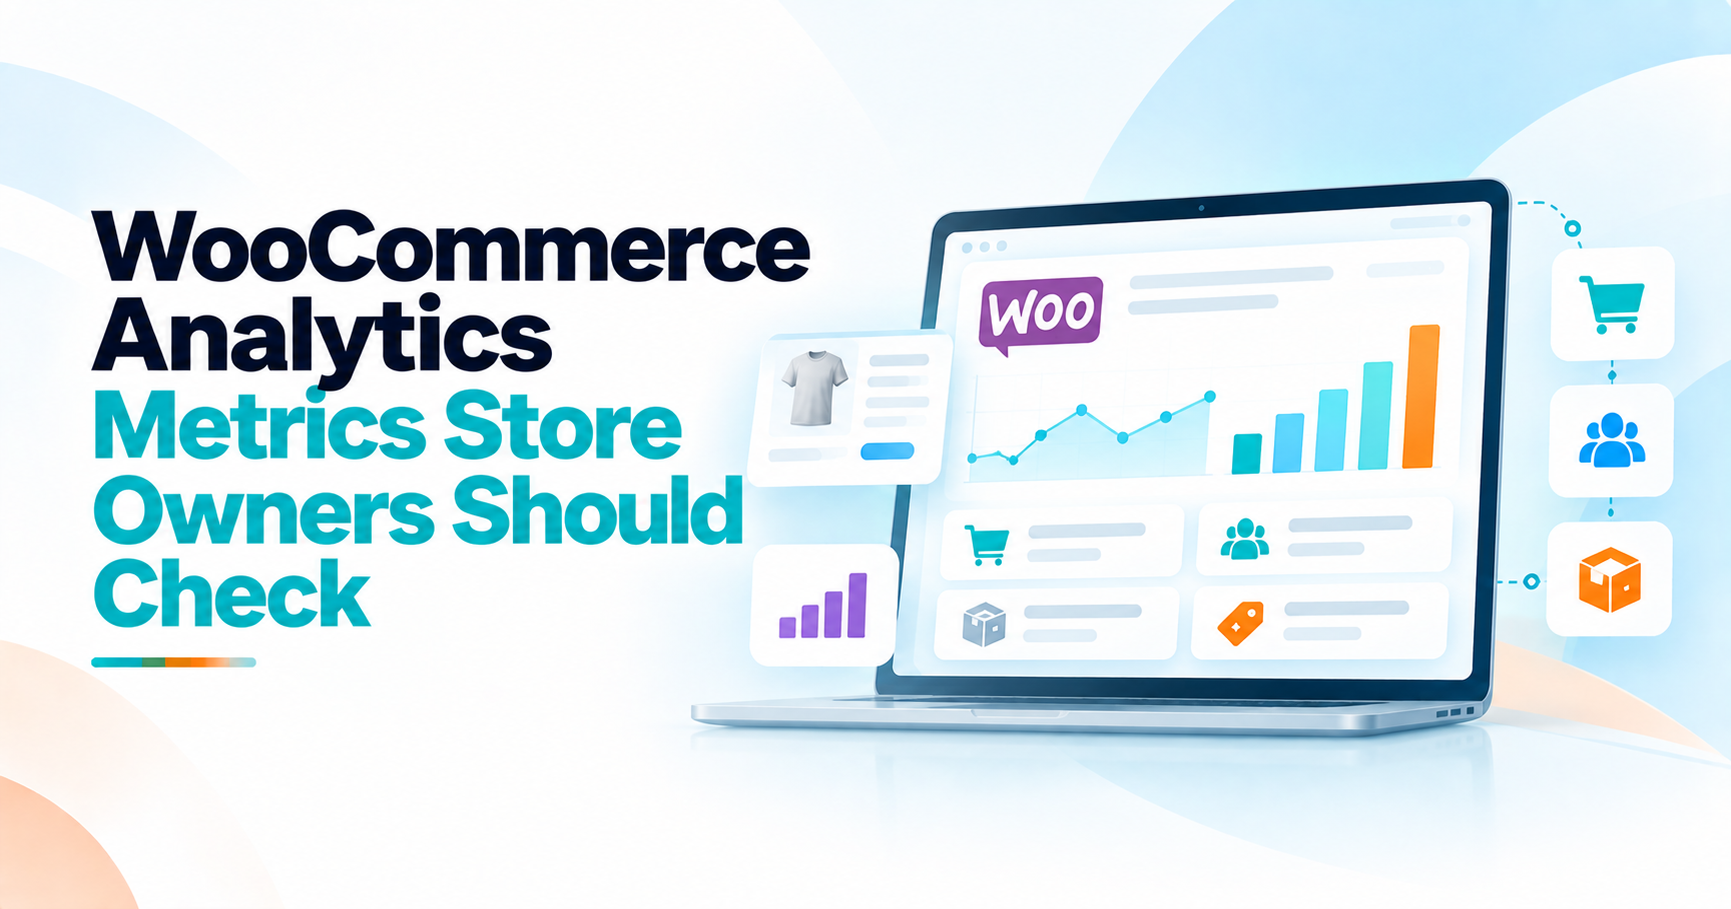
WooCommerce gives store owners access to a lot of data.
You can review gross sales, net sales, orders, average order value, products, customers, coupons, taxes, shipping, refunds and stock. You can compare periods, apply filters, inspect individual reports and export data for further analysis.
The challenge is rarely finding another number. It is knowing which numbers deserve attention first.
If you open the WooCommerce analytics dashboard and try to analyze every available metric equally, routine reporting can quickly turn into noise. A better approach is to begin with the commercial outcome, then move into the customer, product and inventory signals that help explain it.
WooCommerce's current Analytics and Sales Reports already provide detailed reports, filtering, segmentation, CSV downloads and a customizable dashboard. WooCommerce also recommends the Analytics area rather than its older legacy reports, which were deprecated in WooCommerce 4.0.
So before installing another WooCommerce reporting plugin, it is worth understanding what the native analytics system can already tell you and where an additional analytics layer may actually add value.
What Does WooCommerce Analytics Include?
WooCommerce Analytics is the native reporting environment available inside WooCommerce for analyzing store performance.
Its current reporting structure includes dedicated views for revenue, orders, products, variations, categories, customers, stock, coupons, taxes and downloads. The dashboard can also display performance indicators such as total sales, net sales, orders, average order value, products sold, returns, discounts, taxes and shipping.
That makes native WooCommerce analytics much more capable than a simple sales counter.
A merchant can move from a headline result into detailed reports, filter orders by customer type or product, compare products, examine customer spending and check stock status without leaving the WooCommerce environment.
The important question is not whether WooCommerce has analytics. It does.
The question is: Which metrics should you check first, and what should you investigate when one of them changes?
Start With Net Sales, Not Just a Big Revenue Number
For most store owners, the first metric should be a clearly understood sales measure. WooCommerce distinguishes several revenue concepts.
Gross sales represent product selling price multiplied by quantity before returns, coupons, taxes and shipping. Net sales subtract returns and coupons. Total sales then add taxes and shipping to the adjusted sales amount.
That means these numbers answer different questions.
If you want to understand product sales after discounts and returns, net sales is usually more informative than looking only at gross sales.
If you want a broader view that includes tax and customer-paid shipping, total sales provides another perspective.
Do not switch between these definitions without noticing.
A merchant who compares last week's gross sales with this week's net sales may think the business changed when the calculation changed instead.
For weekly operational analysis, start with one consistently defined sales metric and compare it with the equivalent previous period.
Orders Should Be Read Beside Sales
Revenue can rise because more customers placed orders.
It can also rise because customers spent more per order.
That is why the next number to check is order count.
Suppose net sales increased 15%.
If orders increased roughly 15% while average order value remained stable, the business mainly generated more transactions.
If orders remained almost unchanged but revenue increased, customers probably spent more per transaction.
If orders increased but revenue barely moved, average order value may have declined.
This relationship is more useful than reading sales and orders independently.
WooCommerce's Orders report can also be filtered by fields such as order status, products, coupon codes, customer type, refunds and product attributes, which makes it possible to investigate where a change came from once the headline order number moves.
Average Order Value Helps Explain the Gap Between Orders and Revenue
WooCommerce defines average order value as: Net Sales ÷ Orders under its Analytics definitions. That makes AOV one of the first diagnostic metrics to check after revenue and order count.
Imagine:
Net sales decreased 8%.
Orders decreased only 1%.
That tells you order volume probably does not explain most of the revenue decline. Now check AOV.
If AOV fell significantly, the next investigation might involve product mix, discounts, customer mix or availability of higher-value products.
The number itself is not the conclusion. It tells you where to look next.
This is the same principle covered more broadly in Ecommerce Performance Analytics, where commercial outcomes are connected with the factors that may be influencing them.
Product Performance Should Come Next
Once you understand what happened to sales, orders and AOV, check which products created the result.
WooCommerce's Products report currently includes product title, SKU, items sold, net sales, orders, category, variations, stock status and inventory quantity. It also allows merchants to compare multiple products directly.
This gives you much more useful questions than simply: "What was our bestseller?"
Suppose Product A is still your highest-revenue item. That sounds healthy. But what if its net sales fell 25% from the previous comparable period?
The store-level result may hide that decline because another product grew.
A better product review asks:
Which products contributed most to sales?
Which products changed most?
Did the change come from units sold or selling value?
Was stock available throughout the period?
That turns the Products report into an explanation tool rather than a ranking table.
Do Not Separate Product Performance From Stock
This is especially important in WooCommerce because product reports already include stock status and inventory quantity.
A sales decline can mean weaker demand.
It can also mean the product was unavailable.
Suppose a product sold 80 units last week and only 20 this week.
That looks like a serious demand decline.
But if the product went out of stock early in the week, the sales number no longer represents unrestricted demand.
WooCommerce's Stock report lets merchants filter products by In stock, Low stock, Out of stock and On backorder, while displaying SKU, stock status and inventory quantity.
The useful habit is therefore to review high-performing and sharply declining products beside their stock condition.
If a commercially important product is repeatedly reaching low-stock or out-of-stock status, inventory has become a performance issue rather than just an operations issue.
Customer Analytics Should Answer More Than "How Many Customers?"
After sales and products, check customer behavior.
WooCommerce's Customers report includes registered customers and guests, and when guest buyers use the same email address across multiple orders, WooCommerce can associate those orders with the same customer record. The report includes information such as number of orders, total spend, average order value, registration date and activity information.
This supports several useful questions.
Are customers placing more orders?
Are high-spending customers still active?
Is average customer spend changing?
Are more purchases coming from guests or known customers?
Which customers have the greatest historical spend?
But be careful about turning one customer metric into a complete retention conclusion. Total spend tells you historical value. It does not automatically tell you whether the customer is still active. Order count shows frequency.
It does not necessarily tell you whether that frequency is normal for the customer's purchase cycle. For a wider framework around repeat behavior, segments and customer contribution to revenue, see Ecommerce Customer Analytics.
Refunds and Discounts Need to Stay Visible
A store can grow gross sales while weaker revenue quality is developing underneath. WooCommerce's Revenue report breaks performance into gross sales, returns, coupons, net sales, taxes, shipping and total sales. That means store owners should not stop after seeing a positive sales trend.
Suppose gross sales grew 20%.
Coupons increased sharply.
Returns also increased.
Net sales may have grown much less than the headline gross-sales figure suggests. This does not automatically mean the promotion failed. A discount may have been intentionally used to acquire customers or clear inventory. But the result should be understood.
The useful question is: How much of the gross sales improvement remained after discounts and returns?
That gives you a much more realistic view of commercial performance.
Which WooCommerce Metrics Should You Check Every Week?
A practical weekly review does not need every available report. Begin with net sales and compare the result with a meaningful previous period.
Then check orders and AOV to see whether transaction volume or value per order helps explain the movement.
Next, review the products contributing most to the change and check whether inventory affected availability.
Then look at customer activity where it is relevant to the business, especially changes in order frequency, spending or customer mix.
Finally, review returns, discounts and stock risks that could weaken the headline result.
That sequence gives you a useful path: Sales → Orders and AOV → Products → Customers → Inventory → Returns and Discounts
If nothing important changed, you do not need to invent a problem. If something did change, move into the detailed report connected to that issue.
For a broader weekly measurement framework, see Which Ecommerce Metrics Should Store Owners Check Every Week?.
Where Is Native WooCommerce Analytics Strong?
Native WooCommerce analytics is already strong for many everyday store-reporting needs. It provides customizable dashboard indicators, period comparisons, filtering, segmentation, detailed report tables, product comparisons and CSV exports.
Its Product report connects sales with inventory fields.
Its Orders report supports detailed filters.
Its Customers report exposes customer spending and order history.
Its Revenue report explains how sales, refunds, coupons, tax and shipping relate.
For a single WooCommerce store with straightforward reporting requirements, this may answer a large share of routine business questions.
That is important because installing another analytics platform should solve a real problem. You do not need extra software simply because a third-party product has a more modern dashboard.
When Might a WooCommerce Reporting Plugin or Analytics Tool Add Value?
An additional WooCommerce analytics tool becomes more useful when the problem is no longer access to a report.
The problem may be interpretation. For example, WooCommerce can show revenue, orders, customers, products and stock in separate reports.
A merchant may still need to determine how those signals relate. Revenue fell. Orders barely changed. AOV declined. Two premium products also ran low on stock. Returning-customer spending weakened.
All of those facts may already exist in WooCommerce data. The additional value comes from connecting them into a shorter investigation path.
Another analytics layer may also be useful when a business needs AI-assisted explanations, centralized management reporting, additional integrations or other analytical workflows that extend beyond native WooCommerce reporting.
The correct purchasing question is therefore: What business question is difficult to answer with WooCommerce today?
If you cannot name the gap, another reporting plugin may simply duplicate functionality you already have.
Pay Attention to WooCommerce Analytics Settings
Reporting mistakes do not always come from bad analysis. Sometimes the configuration itself changes what appears in the reports.
WooCommerce Analytics lets store owners decide which date field revenue and order reports should use, including Date created, Date paid or Date completed. The documented default is Date Paid.
That matters. An order created on Monday but paid on Tuesday can belong to different dates depending on the setting. WooCommerce also allows order statuses to be excluded from analytics.
If one report or store uses different inclusion rules from another, order totals may differ even when the underlying orders are the same. Before diagnosing a sales discrepancy, verify the date type, order-status rules and reporting period.
Data Freshness Can Also Change What You See
WooCommerce processes analytics data separately from the core order database.
Its current documentation says WooCommerce 10.5 includes an Analytics Updates setting with two options. Scheduled updates process analytics every 12 hours and are recommended for most stores, while Immediate updates process data as new information becomes available.
That means store owners should understand their own update configuration before assuming a temporary discrepancy is a performance problem. WooCommerce also caches analytics data.
If reports appear inconsistent with store data, WooCommerce recommends clearing the Analytics cache and, if necessary, re-importing historical data. Data freshness is not the most exciting analytics topic. But it matters because you cannot interpret a number correctly if it is stale.
Another Common Mistake Is Looking Only at Percentages
Suppose returns increased 100%. That sounds serious.
But did they increase from one return to two?
Or from 100 to 200?
Always check both the percentage change and the absolute value. The same applies to revenue growth, product declines, customer changes and stock movement.
Percentages tell you the relative size of a change. Absolute numbers tell you its business scale. You normally need both.
Do Not Average Store Metrics Without Understanding the Formula
Even inside one WooCommerce business, merchants can create misleading summaries by averaging averages.
Suppose Product Group A has an AOV of $80 across 1,000 orders.
Product Group B has an AOV of $160 across 50 orders.
The combined AOV is not $120.
AOV should be calculated from combined net sales divided by combined eligible orders. This becomes even more important if WooCommerce data is eventually combined with another store or marketplace.
Your Multi-Store Ecommerce Reporting guide explains why ratios and averages should often be recalculated from their underlying values rather than averaged directly.
Where Statty AI Fits for WooCommerce Merchants
Statty AI's updated product direction treats WooCommerce as a major ecommerce platform rather than applying Shopify terminology to every store environment. The strategy specifically positions WooCommerce around connected revenue, customer, product and stock information with clearer interpretation, while acknowledging that WooCommerce already provides comprehensive native reports in those areas.
That is the right distinction. Statty AI should not be positioned as though WooCommerce gives merchants only basic charts. WooCommerce Analytics is already a capable reporting environment.
The opportunity for a connected analytics layer is making relationships between metrics easier to interpret, reducing report switching and helping merchants move more quickly from:
What changed?
to:
Which part of the store should I investigate next?
Statty AI's broader platform positioning is built around connected sales, customers, products, inventory, refunds and AI-assisted explanations based on available commerce data.
You can review the current Statty AI Features to understand the wider analytics approach and check Statty AI Integrations for current connection information.
Final Thoughts
WooCommerce store owners do not need to inspect every report every week. Start with net sales. Then check orders and average order value to understand the first layer behind the result. Review product performance to see where the change came from. Connect product movement with inventory so stockouts are not mistaken for weaker demand.
Look at customer behavior to understand who is creating the revenue. Keep refunds and discounts visible so gross sales do not hide weaker revenue quality. And before drawing conclusions, confirm your date settings, order-status rules and analytics freshness.
Native WooCommerce Analytics already provides a strong foundation for this work.
A separate WooCommerce analytics tool or reporting plugin becomes worthwhile when it solves a specific gap, such as connecting data that currently sits in separate reports, reducing manual analysis or helping the merchant understand what deserves attention next.
The most useful WooCommerce dashboard is not the one showing the most metrics.
It is the one that helps you move quickly from: How did the store perform?
To: What changed, what may explain it, and where should I investigate next?
FAQ
What is WooCommerce Analytics?
WooCommerce Analytics is WooCommerce's native reporting environment for reviewing store performance. It includes dashboards and reports covering areas such as revenue, orders, products, customers, stock, coupons, taxes and downloads, with filtering, comparisons and CSV exports.
Which WooCommerce metrics should I check first?
For a regular store-performance review, start with net sales, orders and average order value. Then review the products driving the change, customer behavior, stock availability, returns and discounts. This creates a clearer investigation path than treating every metric equally.
What is the difference between gross sales, net sales and total sales in WooCommerce?
WooCommerce defines gross sales as product selling price multiplied by quantity before returns, coupons, taxes and shipping. Net sales subtract returns and coupons. Total sales then add taxes and shipping to the adjusted sales amount.
Does WooCommerce include customer analytics?
Yes. WooCommerce's Customers report includes customer order count, total spend, average order value, registration and activity information, and supports filters such as location, number of orders and total spend.
Can WooCommerce Analytics show low-stock and out-of-stock products?
Yes. The Stock report can filter products by In stock, Low stock, Out of stock and On backorder, while displaying SKU, stock status and inventory quantity.
Do I need a WooCommerce reporting plugin?
Not necessarily. Native WooCommerce Analytics already covers many common sales, order, product, customer and stock reporting needs. An additional reporting or analytics product is more useful when you have a clearly defined gap that native reports do not solve efficiently.
Why do my WooCommerce Analytics numbers sometimes look outdated?
WooCommerce Analytics processes and caches reporting data. Current WooCommerce documentation says analytics can update on a scheduled 12-hour cycle or immediately, depending on the store's setting. If reports appear incorrect, WooCommerce recommends checking the analytics cache and historical import.
What is the difference between WooCommerce Analytics and the old WooCommerce Reports?
WooCommerce's older Reports section is considered legacy. WooCommerce states that those reports were deprecated with WooCommerce 4.0 and recommends the newer Analytics section for detailed sales data, filters, segments, CSV exports and dashboard reporting.