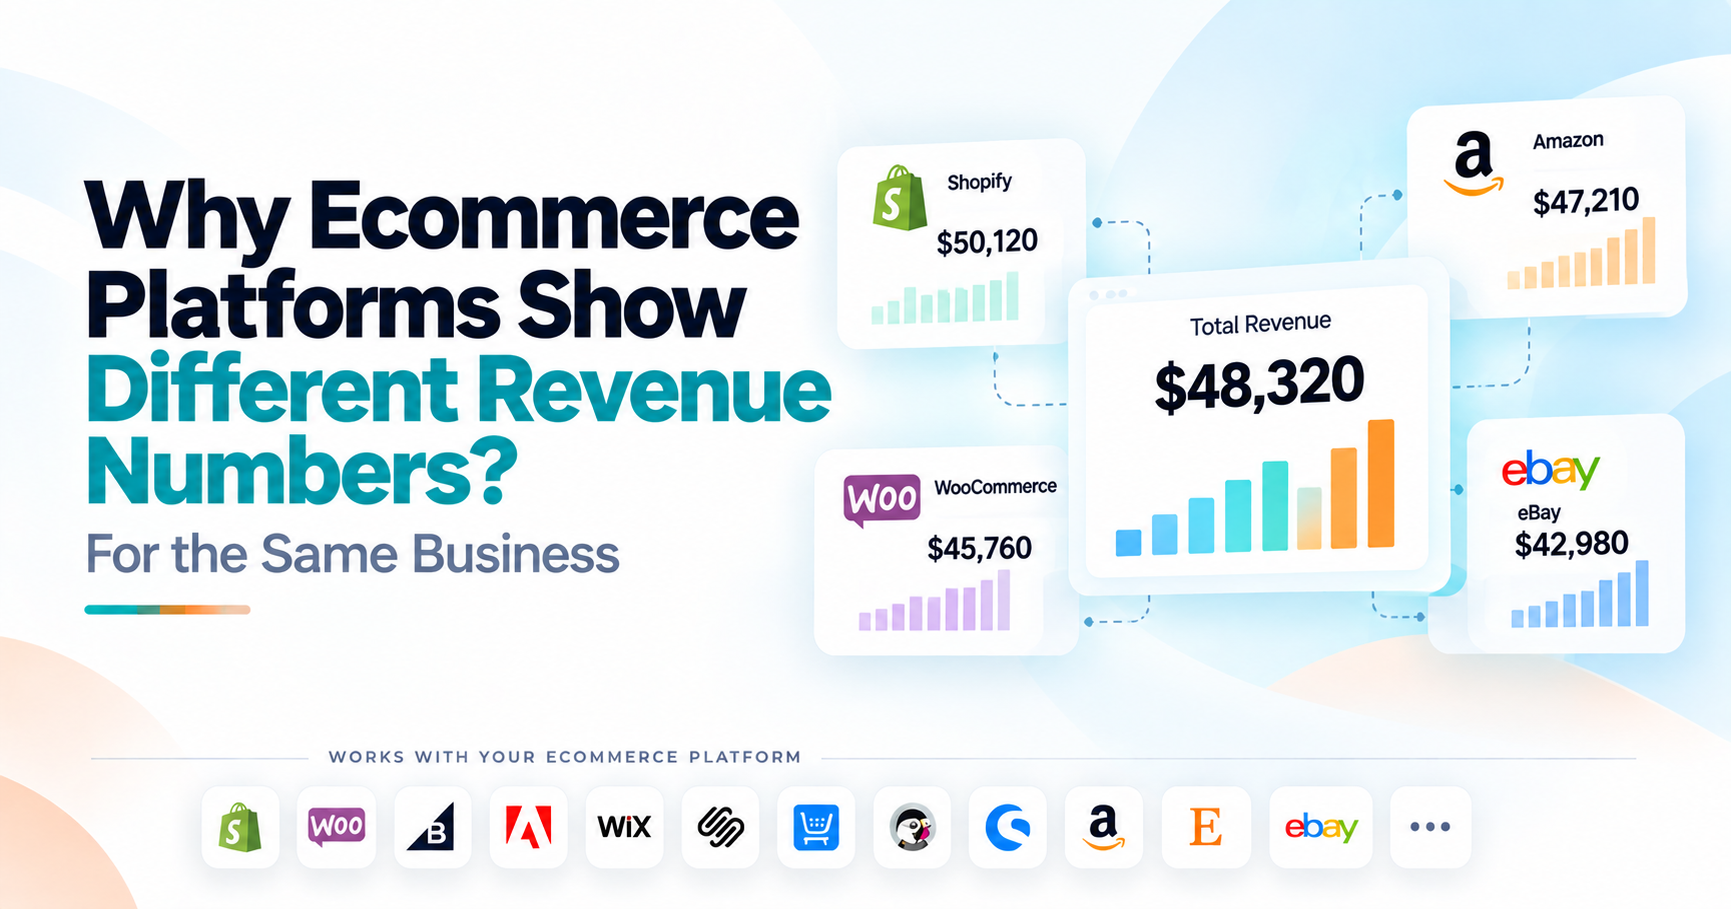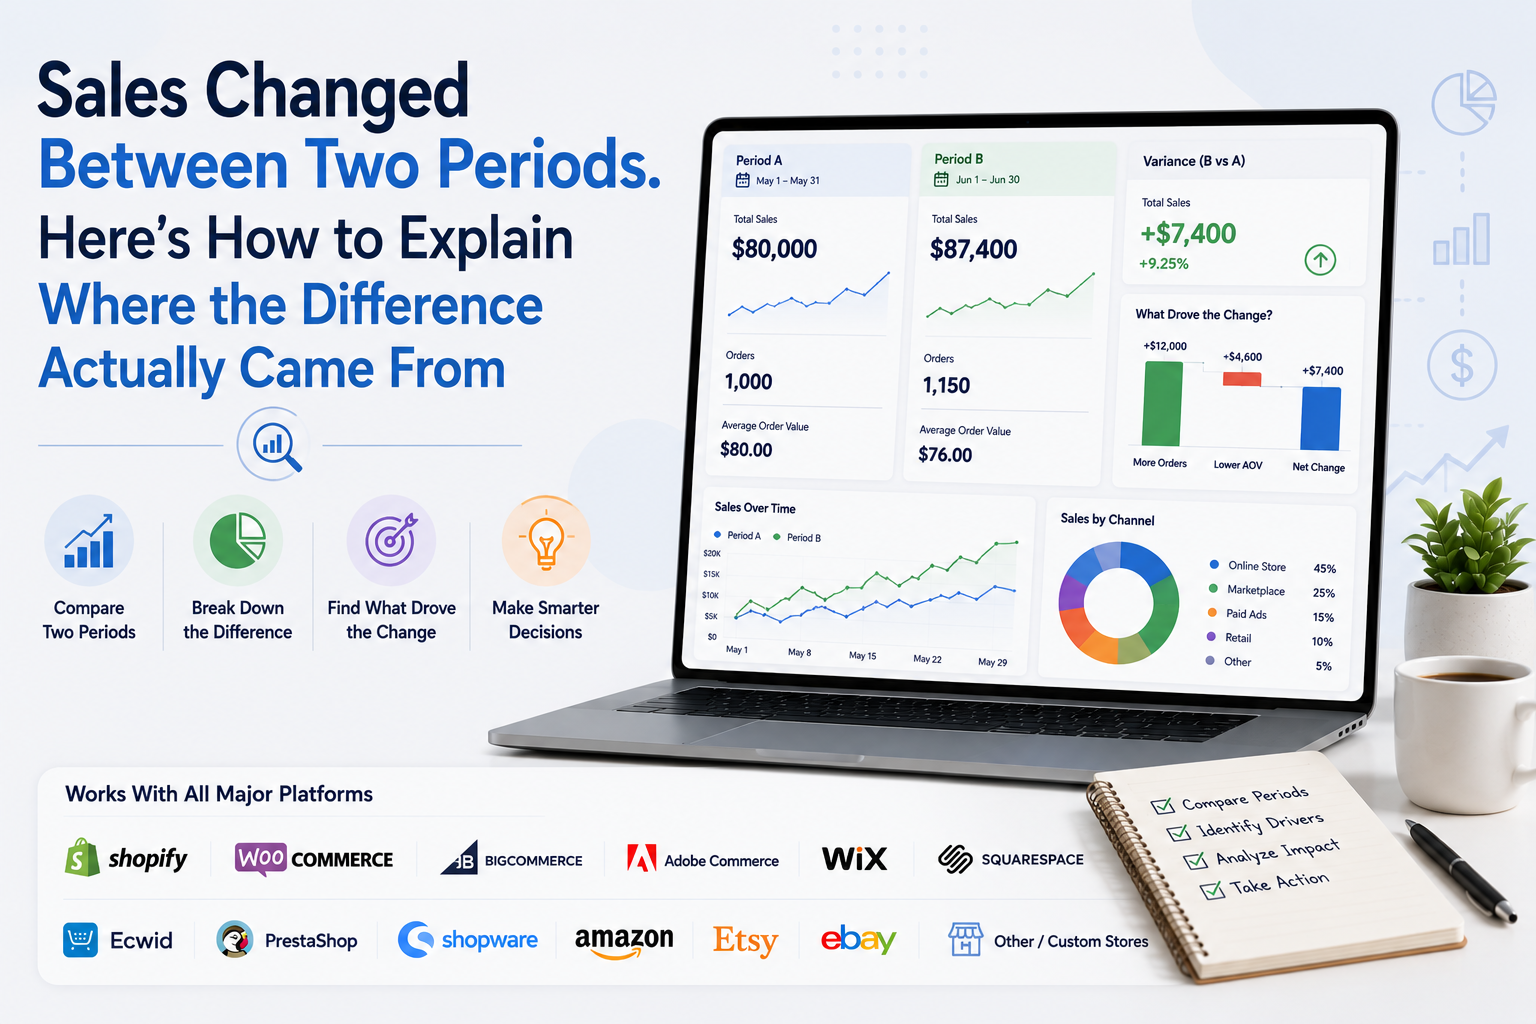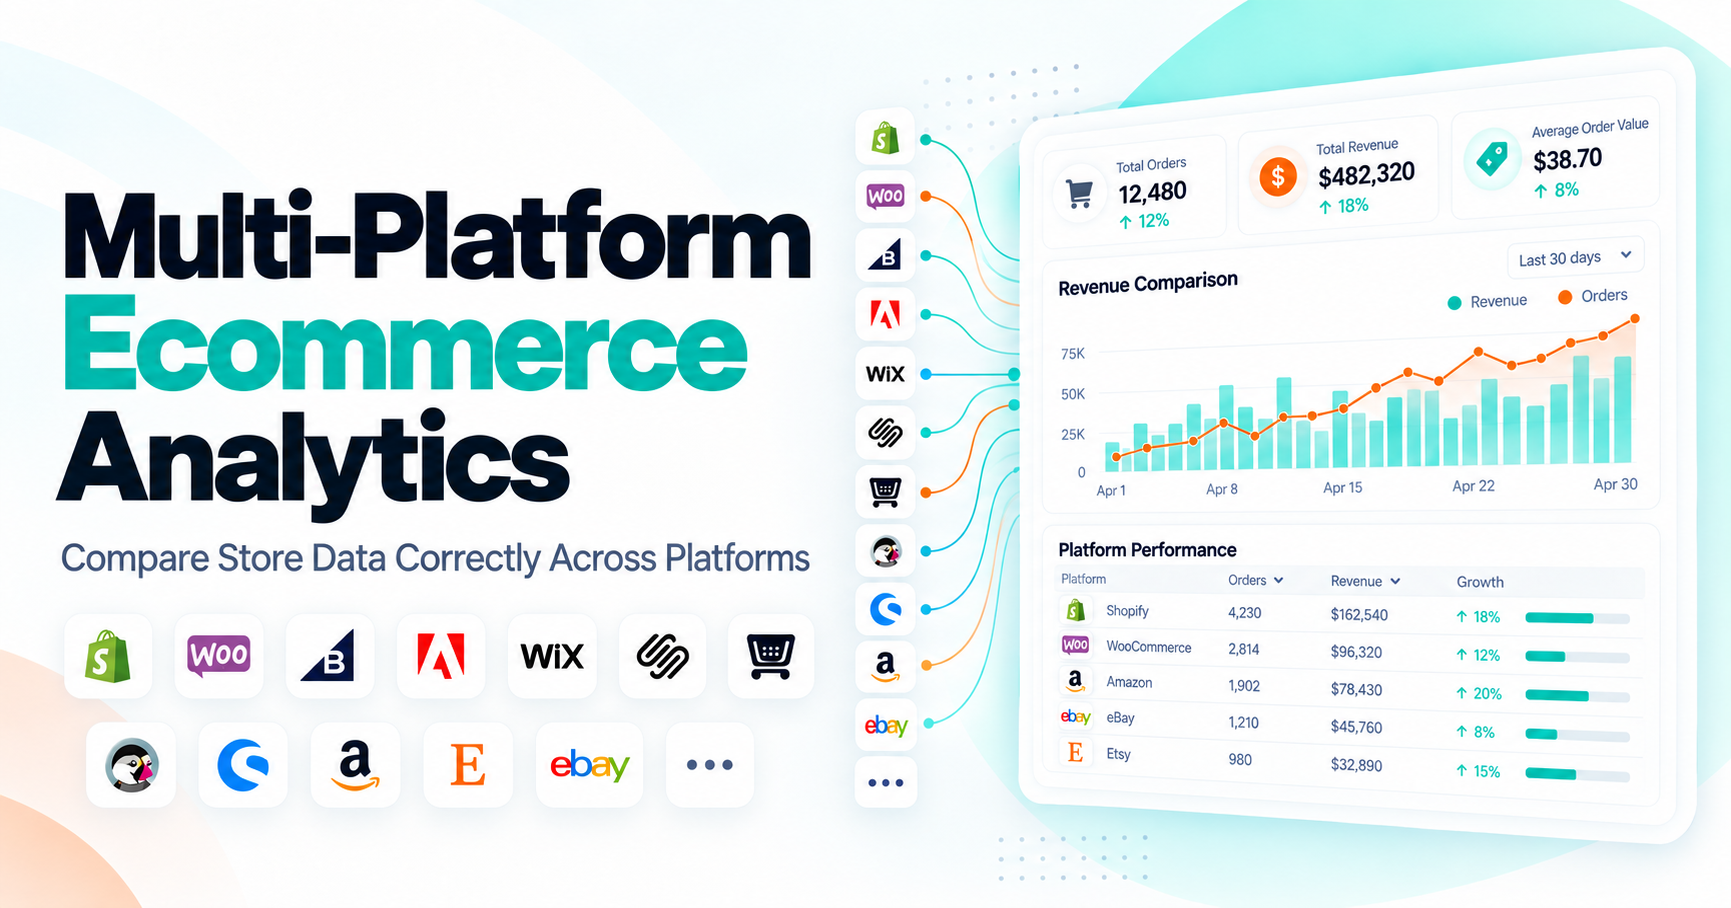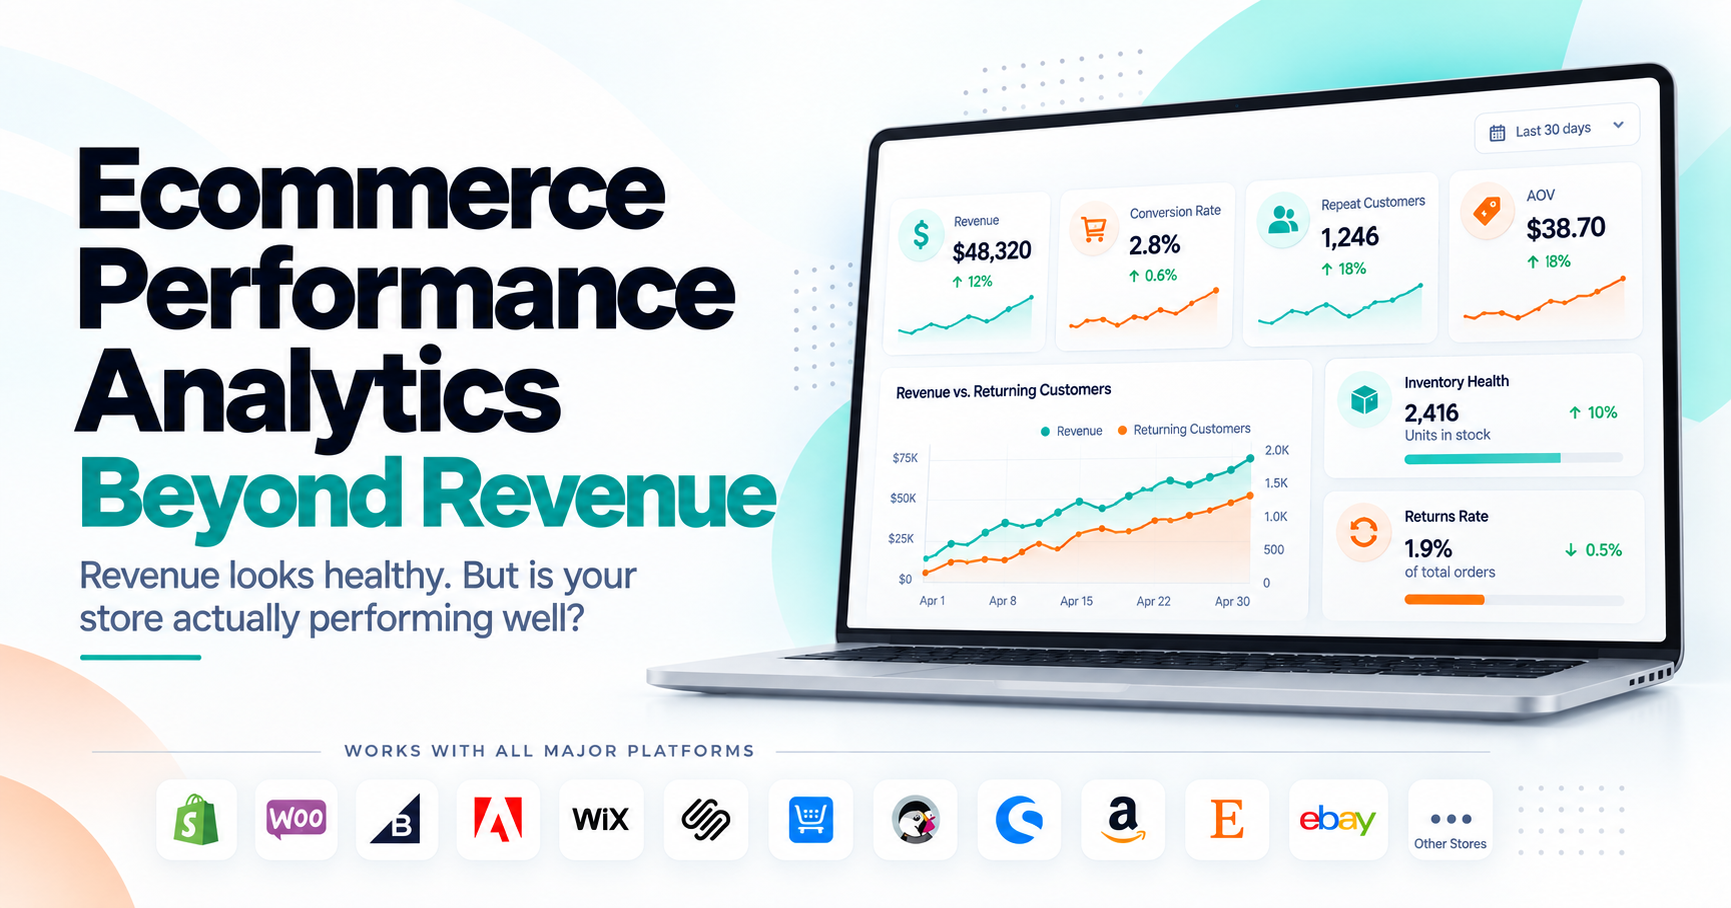
Revenue is up 12%. At first glance, your store looks healthy.
But returning customers are purchasing less often. Two of your strongest products are repeatedly running low. Refunds are increasing. Checkout completion has weakened. Most of the revenue growth came from a promotion that will not continue next month.
Is the store actually performing better?
Maybe, but revenue alone cannot answer that question.
This is where ecommerce performance analytics becomes useful. It looks beyond a single outcome and connects commercial results with the customer, product, inventory, purchasing and post-purchase signals that help explain how the business is performing.
The objective is not to monitor every number your ecommerce platform can produce. It is to understand whether the different parts of the store are supporting sustainable performance or whether one strong headline metric is hiding a developing problem.
What Is Ecommerce Performance Analytics?
Ecommerce performance analytics is the process of evaluating how effectively an online store is performing by connecting business outcomes such as revenue and orders with the factors that influence those outcomes. That means looking beyond the final sales number.
A useful performance analysis might connect revenue with order volume and average order value, customer acquisition with repeat purchasing, product demand with stock availability, or completed orders with refunds and returns.
This makes ecommerce performance analytics broader than ordinary sales reporting. A sales report might tell you that revenue increased.
Performance analytics asks whether the increase came from healthy demand, heavier discounting, a temporary promotion, stronger repeat purchasing, improved conversion or another factor. It also asks whether anything else changed that could affect future performance.
Revenue Is an Outcome, Not a Complete Health Score
Revenue matters. It is one of the clearest commercial results an ecommerce business can measure. But it is usually a lagging indicator.
Microsoft defines lagging KPIs as measurements of what has already happened, while leading KPIs are forward-looking measures that can provide earlier signals about where performance may be heading. Microsoft also recommends using leading and lagging indicators together rather than relying on only one type.
That distinction is important for ecommerce. Revenue tells you the value of sales already generated.
It does not necessarily tell you that a bestseller is about to run out of stock.
It does not tell you that fewer existing customers are returning.
It does not tell you that shoppers are increasingly abandoning checkout.
It does not tell you that refunds are starting to rise around one product.
Those signals may affect revenue later. A healthy performance view therefore needs both outcomes and the conditions that may influence future outcomes.
Leading and Lagging Indicators Should Be Connected to a Goal
A metric is not automatically a leading or lagging indicator in every situation. Its role depends on what you are trying to understand.
If your goal is monthly revenue, completed sales are a lagging result. Checkout progression, product availability or changes in returning-customer activity may provide earlier signals worth monitoring.
If your goal is reducing stockouts, current stock quantity alone is not enough. Demand rate and replenishment timing become important because they help indicate whether existing inventory is likely to remain sufficient.
This is why ecommerce KPIs should not be classified in isolation.
Ask: What outcome are we trying to protect or improve, and which signals could change before that outcome becomes visible?
That creates a much more useful performance model.
Commercial Performance Starts With Revenue, Orders and Order Value
The first layer of an ecommerce performance analysis should establish the commercial result.
Revenue shows the value generated.
Orders show transaction volume.
Average order value helps explain how much value each transaction generates on average.
Suppose revenue increases 10%.
If orders also increase by approximately 10% while average order value remains stable, the growth is largely associated with more transactions.
If orders remain flat but AOV rises, the store is generating more value from each purchase.
If orders increase significantly while AOV falls, revenue may still grow, but the economics of that growth deserve more attention.
These relationships matter more than any one metric by itself. That is why our guide on the ecommerce metrics that actually matter recommends reading business outcomes together with the drivers that can explain them.
Traffic and Conversion Show Whether Demand Is Reaching Purchase
For an owned ecommerce website, the next layer is the buying journey. More traffic does not automatically mean better store performance.
If sessions increase 30% while purchases barely move, the business attracted more visitors without converting much of that additional demand.
Google Analytics' Purchase journey report follows users through session start, product viewing, adding to cart, beginning checkout and purchase. Its purpose is to help identify where shoppers leave the purchase funnel.
The Checkout journey report goes deeper into the later stages and can reveal drop-off between beginning checkout, adding shipping details, adding payment information and purchasing. Google specifically describes this report as useful for finding checkout bottlenecks.
So if revenue weakens, do not immediately assume demand disappeared. The issue could be:
Visitors stopped reaching product pages.
Product interest remained but fewer shoppers added items to cart.
Checkout starts remained stable but payment completion declined.
Each pattern points to a different part of the customer journey.
Customer Performance Tells You What Kind of Growth You Are Creating
Two stores can generate exactly the same revenue growth with very different customer health.
Store A grows mainly because it acquired many new customers.
Store B grows because previous customers returned and purchased again.
Neither pattern is automatically better. But they represent different growth engines. Customer performance analysis should therefore look beyond total customer count. New customers tell you whether the business is continuing to attract buyers.
Returning customers help show whether previous buyers are coming back. Repeat purchasing helps reveal whether customer relationships extend beyond the first transaction. Customer contribution to revenue shows whether growth depends heavily on one group.
A business can report healthy total sales while repeat-customer activity quietly weakens. New acquisition may temporarily compensate for that decline. Without customer analytics, the headline revenue number can hide that shift. Your existing Shopify customer analytics guide explores this customer layer in more detail.
Product Performance Should Be Connected With Inventory
A product's sales result does not tell you everything about product performance. Suppose Product A generated 25% less revenue this month. One interpretation is that demand weakened.
But what if the product was out of stock for ten days?
The same sales decline now means something different. WooCommerce's current Products report illustrates why product and stock information belong close together. It reports items sold, net sales, orders, stock status and inventory quantity at product level.
That relationship matters across ecommerce platforms. A product can have strong demand but weak sales because customers could not buy it.
Another product may have plenty of stock but declining sales because demand genuinely weakened. A third may generate high revenue while approaching a stockout that threatens future sales.
Performance analytics should help distinguish among those situations. For deeper inventory analysis, see Shopify Inventory Analytics: What to Track Before Stock Becomes a Sales Problem.
Inventory Is a Performance Constraint, Not Just an Operations Metric
Inventory is sometimes treated as a separate warehouse concern. For ecommerce performance, that separation can be misleading.
If one product accounts for a meaningful share of revenue and that product becomes unavailable, inventory becomes a sales constraint.
WooCommerce's stock reporting, for example, distinguishes products that are in stock, low stock, out of stock or on backorder.
A useful performance analysis adds commercial context to those inventory states. Twenty units remaining might be perfectly healthy for a product that sells one unit per month.
The same twenty units may represent serious risk for a product selling fifteen units every day. That is why inventory performance should be evaluated alongside demand rather than as a raw quantity.
Post-Purchase Performance Shows Whether Completed Revenue Stays Healthy
Performance does not end when the customer places the order. Refunds, returns and fulfillment can change the quality of the result after purchase.
WooCommerce's Revenue report, for example, separates gross sales, returns, coupons, net sales, taxes, shipping and total sales so merchants can see how different components contribute to the final revenue picture.
Imagine gross sales increase 15%. That looks strong. Now imagine refunds increase 40%.
The correct conclusion is not automatically that store performance deteriorated, but the refund change deserves investigation.
Is the increase concentrated around one product?
Did a promotion attract customers with poor product fit?
Did a product description create unrealistic expectations?
Did fulfillment create a problem?
Post-purchase metrics help determine whether completed orders are producing the business outcome you expected.
A Healthy Ecommerce Store Needs More Than Green Numbers
One of the biggest mistakes in store performance analytics is assuming that every metric needs to move upward. That is not how ecommerce works.
AOV may fall because the business successfully acquired more first-time customers who begin with smaller purchases.
Conversion may improve during a promotion while gross margin weakens.
Inventory may decline rapidly because a product is performing extremely well.
Refunds may temporarily rise because total order volume grew significantly.
Performance needs context.
The goal is not to make every KPI green. The goal is to understand whether the relationships among the metrics make commercial sense.
Performance Bottlenecks Matter More Than Metric Rankings
A performance bottleneck is the part of the system currently limiting the result you care about.
Suppose traffic is strong.
Product views are healthy.
Add-to-cart activity is stable.
But a large percentage of customers disappear between beginning checkout and completing payment. The bottleneck is probably not top-of-funnel acquisition.
Google Analytics explicitly recommends using purchase and checkout journey reporting to identify stages where users abandon the buying process.
Now imagine conversion is healthy, but your strongest products are repeatedly unavailable. The bottleneck moved to inventory. Or perhaps acquisition and conversion are both healthy, but almost no first-time customers return.
The constraint may be retention rather than acquisition. This is why ecommerce performance analysis should follow the sequence of the business rather than treat every metric as an independent score.
How Do You Find the Real Performance Bottleneck?
Start with the outcome that changed.
If revenue declined, determine whether orders or order value explain the first layer of the movement.
If orders declined, look upstream at traffic, conversion and the purchase journey where those measurements are available.
If only a small group of products declined, investigate those products and their stock availability rather than assuming the entire store has a demand problem.
If new-customer sales remain strong but returning-customer revenue weakens, examine retention instead of automatically increasing acquisition spend.
The principle is simple: Move from outcome to driver to constraint.
The principle is simple: Move from outcome to driver to constraint.
Do not begin with the metric you personally manage. Begin with the business result and follow the evidence. Our guide on why online store sales drop provides a more detailed diagnostic workflow for declining sales specifically.
What Should an Ecommerce Performance Dashboard Show?
A useful ecommerce performance dashboard should show enough information to identify whether the business is healthy without becoming a wall of metrics.
The first layer should contain commercial outcomes such as revenue and orders.
The second layer should contain the most relevant drivers, such as AOV, customer mix, product contribution or purchase conversion.
The third layer should highlight constraints or risks such as low stock on commercially important products, unusual refund activity or meaningful funnel deterioration.
That structure creates a natural sequence: Outcome → Driver → Constraint → Investigation
The dashboard is not supposed to answer every question on the first screen. Its job is to make the next question obvious. For a fuller dashboard framework, see What Should an Ecommerce Analytics Dashboard Actually Show?.
Build a Balanced Performance View Instead of Tracking Everything
A balanced ecommerce performance view does not require dozens of permanent KPIs. For each major business objective, choose a small number of signals with different jobs.
If the objective is profitable sales growth, you might monitor revenue as the outcome, orders and AOV as immediate drivers, customer mix as context, and inventory or refunds as possible constraints.
If the objective is improving repeat business, the outcome and drivers should change accordingly.
The important part is balance. Microsoft's KPI guidance recommends connecting KPIs to business objectives, defining them consistently, assigning ownership and combining leading with lagging indicators. That is far more useful than building a dashboard because a software platform happens to offer fifty cards.
Use Baselines and Targets Instead of Universal "Good" Numbers
Store performance should normally be evaluated against relevant context rather than a universal benchmark.
A 2% conversion rate might represent strong performance for one business and weak performance for another depending on product category, traffic source, price, geography and buying behavior.
The same is true for AOV, repeat purchase rate, refund rate and many other ecommerce KPIs. Useful comparisons include your own historical baseline, an equivalent previous period, a meaningful target and relevant segment-level performance.
Shopify's current analytics dashboard reflects this contextual approach by surfacing trends across sales, orders, AOV, returning-customer rate, sessions, conversion and fulfillment rather than presenting one universal store-health score.
This is a better way to interpret performance. Ask whether the store is improving relative to its own business context and goals.
Ecommerce Performance Looks Different Across Platforms
A balanced performance view should also respect where the business sells. An owned Shopify, WooCommerce, BigCommerce, Wix or Squarespace store may provide detailed website-funnel data.
Amazon, Etsy and eBay expose different marketplace-specific signals. Forcing the exact same performance model onto every channel can produce misleading conclusions.
Website sessions and checkout progression may be meaningful for an owned storefront. For a marketplace account, product visibility, listing performance, ordered sales, units, inventory or marketplace-specific seller signals may be more relevant.
Standardize the business outcomes that are genuinely comparable. Preserve platform-specific measures when they explain performance better. This is particularly important as ecommerce businesses become more multichannel.
Where Statty AI Fits
Statty AI is designed around connected ecommerce performance rather than treating sales, customers, products and inventory as completely separate reporting areas.
The updated Statty AI direction brings available sales, customer, product, inventory, refund and operational signals into a clearer analytics experience and uses AI-assisted explanations to help merchants understand meaningful changes in connected commerce data.
Current platform availability is not identical across every connector. Shopify, WooCommerce and BigCommerce are currently marked ready, while several additional platforms and marketplaces are available through request-access or upcoming integration paths.
You can review the current platform status through Statty AI Integrations and explore the current analytics capabilities through Statty AI Features. The purpose of this connected approach is not to invent explanations automatically.
It is to make relationships easier to investigate.
If revenue changes, the useful next step may be orders and AOV.
If product sales change, inventory may provide necessary context.
If overall sales look healthy, customer and refund signals may show whether that performance is as strong as the headline suggests.
Final Thoughts
Ecommerce performance analytics is not about finding one perfect metric that tells you whether your store is healthy. That metric does not exist.
Revenue tells you what the business sold.
Orders tell you how much transaction activity occurred.
AOV tells you how much value each order generated on average.
Customer analytics helps show whether buyers are returning.
Product analytics reveals where sales are being created.
Inventory helps show whether product availability can support demand.
Checkout data shows where purchase intent may be breaking down.
Refunds and returns help show what happens after a sale is completed.
The value appears when these signals are interpreted together. A strong performance view should therefore help you answer three questions:
What business outcome changed?
Which driver or constraint appears connected to that change?
What deserves investigation or action next?
That is a much more useful definition of store health than simply asking whether revenue went up.
FAQ
What is ecommerce performance analytics?
Ecommerce performance analytics is the process of evaluating store performance by connecting outcomes such as revenue and orders with customer, product, inventory, purchasing and post-purchase signals. It helps merchants understand not only what happened, but which parts of the business deserve further investigation.
What is the difference between ecommerce analytics and ecommerce performance analytics?
Ecommerce analytics is the broader practice of analyzing ecommerce data. Ecommerce performance analytics focuses specifically on whether the store is achieving its business objectives and which drivers, constraints or risks are affecting those results.
Is revenue enough to measure ecommerce store performance?
No. Revenue is an important outcome, but it does not explain customer retention, product availability, conversion, refunds or other conditions that can strengthen or weaken future performance. Revenue should be interpreted with the metrics that help explain it.
What are the most important ecommerce performance KPIs?
There is no universal KPI list for every business. Revenue, orders and AOV are common commercial outcomes and drivers, but useful performance analysis may also require customer retention, product contribution, inventory availability, conversion, checkout completion and refunds depending on the decision being made.
What is the difference between a leading and lagging ecommerce KPI?
A lagging KPI measures an outcome that has already occurred, such as completed revenue. A leading KPI provides an earlier signal that may influence a future outcome. Which metrics are leading or lagging depends on the goal being measured, so the two types should normally be used together.
How often should ecommerce performance be reviewed?
Operational problems such as payment failures or critical stockouts may need daily attention. Broader performance is often easier to interpret weekly or monthly because longer periods reduce normal day-to-day noise. The right frequency depends on transaction volume, seasonality and how quickly the metric can reasonably change.
Can one performance dashboard work across Shopify, WooCommerce, Amazon, Etsy and other platforms?
It can provide a shared business view for metrics that are genuinely comparable, but every platform exposes different data. Owned storefronts and marketplaces should not be forced into identical funnel or customer models. A useful multi-platform dashboard standardizes common outcomes while preserving platform-specific performance signals where necessary.