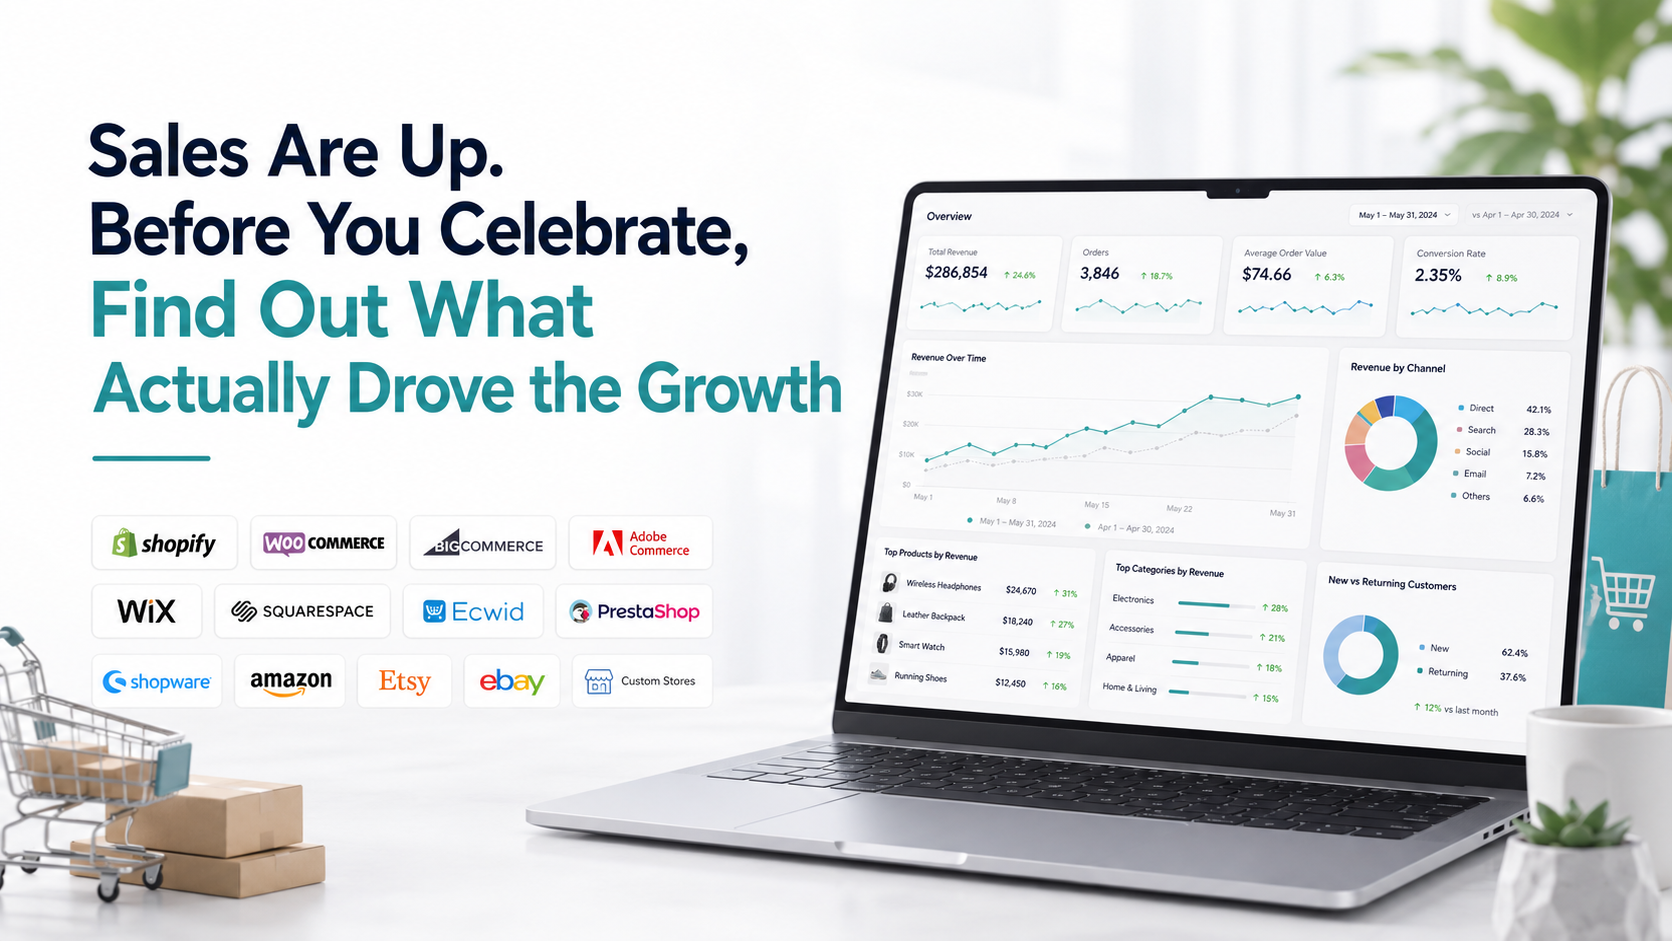
Sales increased 24% this month. That is good news. But it is not yet an explanation. Maybe more people visited your store. Maybe conversion improved. Perhaps customers spent more per order. A bestselling product might have returned to stock.
A promotion could have generated a short burst of orders. Returning customers may have purchased more frequently. Or one unusually large marketplace order may have distorted the entire month.
All of these situations can produce higher revenue. They do not represent the same kind of growth. That is why ecommerce sales growth analysis should go beyond asking whether sales increased. The useful question is:
What created the additional revenue, and is that growth likely to continue?
Once you answer that, you can decide what deserves more investment and what was simply a temporary lift.
Start With the Amount of Growth, Not Just the Percentage
Suppose revenue increased from $100,000 to $120,000. That is 20% growth. But it also means the business generated $20,000 of additional revenue. Your analytical job is to explain as much of that additional $20,000 as possible.
This is a better mindset than opening ten dashboards and looking for green percentages. Think of the increase as a pool of incremental revenue. Then ask:
- Where did it come from?
- More orders?
- Larger orders?
- Different customers?
- Different products?
- Different channels?
- Improved product availability?
- Fewer refunds?
The goal is to build a growth bridge between the previous period and the current one.
First Confirm That the Growth Is Real
Before explaining growth, make sure the comparison itself is valid. Compare equivalent periods. Do not compare an incomplete month with a completed month. Be careful when one period contained a major holiday, sale, launch or unusually large order.
Also use the same metric definition in both periods. Shopify, for example, distinguishes metrics such as total sales, orders, average order value, gross profit and other sales measures rather than treating every commercial number as one interchangeable version of revenue.
If this month's "sales" includes shipping and taxes but your comparison uses a different sales definition, the growth calculation can be misleading before the investigation even begins. For a deeper methodology around fair date comparisons, see How to Compare Store Performance Between Two Periods.
The Simplest Growth Equation
For a direct ecommerce website, a useful starting model is: Revenue ≈ Traffic × Conversion Rate × Average Order Value
It is intentionally simplified. But it gives you three major places to investigate. If revenue increased, one or more of these probably changed: More potential customers reached the store. A larger percentage of visitors purchased. Customers spent more when they purchased.
For marketplaces such as Amazon, Etsy or eBay, replace website sessions with the most appropriate marketplace visibility or visit metric available to you. The principle remains the same. More buying opportunities × better purchase completion × more value per purchase = more revenue.
A Simple Growth Decomposition Example
Imagine your store moved from:
Previous period: 100,000 sessions, 2.5% conversion rate, $60 average order value. That produces approximately: 2,500 orders, $150,000 revenue. Now the current period shows: 110,000 sessions, 2.7% conversion rate, $63 average order value
That produces approximately: 2,970 orders, $187,110 revenue. Revenue grew by $37,110, or about 24.7%. Now break that increase apart. Holding the old conversion rate and AOV constant, the extra 10,000 sessions contributed roughly $15,000.
The improvement from 2.5% to 2.7% conversion contributed roughly another $13,200 when applied to current traffic at the old AOV. The increase from $60 to $63 AOV contributed roughly another $8,910. Together: $15,000 traffic effect
- $13,200 conversion effect
- $8,910 AOV effect= $37,110 additional revenue
Now "sales grew 24.7%" becomes much more useful. You can say growth came from all three major drivers, with additional traffic contributing the largest single share.
This arithmetic does not prove causation. It decomposes where the mathematical change appeared. That distinction matters throughout the article.
Did Growth Come From More Traffic?
If website sessions increased significantly, determine where those additional visitors came from. Google Analytics' Traffic acquisition report can break traffic down by source, medium, campaign, and other acquisition dimensions across organic and paid sources.
Suppose: Revenue increased 18%, Traffic increased 22%, Conversion and AOV barely moved. A reasonable conclusion is that additional traffic explains much of the growth. Now go deeper.
- Which source created the extra visits?
- Organic search?
- Paid social?
- Paid search?
- Email?
- Referral traffic?
- Direct traffic?
- A specific campaign?
Do not simply reward the channel with the biggest percentage increase. Look at how much incremental revenue or order volume the additional traffic produced.
More Traffic Is Not Automatically Better Growth
Imagine paid social traffic doubles. Sales increase too. That sounds excellent. But conversion from those visitors is much weaker than your existing traffic, so customer acquisition cost may also have increased.
Now imagine organic traffic increases 12%, conversion remains strong, and the new visitors purchase high-value products. Both scenarios generate more revenue. The quality of the growth differs. This is why acquisition growth should be reviewed alongside conversion, AOV and customer quality rather than judged from sessions alone.
Shopify's current marketing reporting can compare channels using measures including sales, sessions, orders, conversion, AOV, ROAS, first-time customers, and returning customers. That combination provides much more context than "Channel X generated more traffic."
Did Conversion Improve?
Sometimes traffic remains almost unchanged but revenue increases. Now check purchase conversion. Suppose:
Traffic +2%Orders +17%AOV +1%
The biggest change is probably not acquisition. More of the existing traffic is turning into orders. The next question is where the buying journey improved.
Google Analytics' Purchase journey report currently tracks progression through session start, product view, add to cart, checkout, and purchase.
Compare the relevant stages between periods. Maybe product views are similar, but more users add products to cart.
Perhaps checkout starts barely changed, but more users completed purchase. Maybe a mobile checkout problem was fixed.
Do not stop at: Conversion increased**.** Ask: Which stage of the purchase journey improved? That gives you something specific to preserve or build on.
What If Checkout Completion Created the Growth?
Checkout improvement can create meaningful revenue without bringing one extra visitor to the store. Suppose you previously had 2,000 checkout starts and 1,200 purchases. After fixing a payment issue, 1,400 shoppers complete their purchases.
Traffic did not improve. Product interest did not improve. Your ability to convert high-intent shoppers improved.
Google Analytics' Checkout journey report can show progression from beginning checkout through shipping, payment, and purchase when the appropriate ecommerce events are implemented.
That is a very different form of growth from acquisition. It may also be more efficient because you captured more revenue from demand you already had.
Did Customers Simply Spend More?
Revenue can grow while order count remains almost unchanged. Suppose:
Revenue +15%Orders +2%
Average order value deserves immediate attention. Shopify defines AOV as the average value of orders placed and provides reporting for how AOV changes over time. If AOV increased, investigate what customers actually bought.
- Did they purchase more units?
- Did premium products contribute more?
- Did bundles perform better?
- Did a free-shipping threshold encourage larger baskets?
- Did lower-priced products become less important?
- Did pricing change?
The useful conclusion might be: Revenue grew mostly because customers purchased higher-value baskets, not because the store generated substantially more orders. That tells you exactly what to investigate next.
Product Mix Can Create Growth Without Better Conversion or More Traffic
This is one of the most important growth drivers to check. Imagine your store sells three product categories. Traffic remains stable. Conversion remains stable. Orders barely change. But customers shift toward higher-priced products.
Revenue rises. Nothing dramatic happened to the funnel. The product mix changed. Shopify's product insights can currently show product net sales over time, sales by channel, sales-related traffic sources, and first-time versus returning customers for a product.
Use product-level analysis to identify which products contributed most to the increase. Do not just open the bestseller list. Ask: Which products generated more revenue than they did in the comparison period? That is contribution analysis.
Find the Products That Created the Incremental Revenue
Suppose total store revenue increased by $30,000. Product A contributed +$18,000. Product B contributed +$9,000. Product C contributed +$6,000. The remaining catalog combined contributed -$3,000.
Total change: +$30,000. This tells you something important. The store grew overall, but the growth was concentrated in only three products. Now investigate those products.
- Were they promoted?
- Did rankings improve?
- Was stock availability better?
- Was pricing changed?
- Did an influencer mention one of them?
- Were they newly launched?
- Did marketplace visibility increase?
The more concentrated the growth is, the more carefully you should assess whether it can continue.
Growth From a New Product Is Different From Growth Across the Existing Catalog
Imagine revenue increased 25%. Then you discover that a product launched last month generated nearly all of the extra revenue. That may be a very successful launch. But you should not conclude that the entire existing catalog improved by 25%.
- Separate: Growth from existing products
- From: Growth from new products
This is especially important when evaluating marketing, merchandising, and underlying store health. A strong new launch can hide weakness elsewhere.
Likewise, flat store-level revenue can hide excellent growth in new products if several older products are declining.
Inventory Can Create Growth by Removing a Previous Constraint
Sometimes growth happens because a product becomes available again. Suppose your highest-demand product was out of stock for much of the previous month. This month it remained available. Sales increase significantly.
The business did not necessarily create new demand. It captured demand that previously could not be fulfilled. Shopify's inventory analytics includes measures such as sell-through rate and days of inventory remaining, designed to help merchants understand how quickly inventory is selling and how long stock may last.
If a high-performing product returned to stock during the growth period, quantify how much additional revenue that product contributed. This type of growth may be highly repeatable if the business can maintain availability. For deeper inventory analysis, see Shopify Inventory Analytics: What Merchants Should Track.
Did New Customers Cause the Growth?
A growing store often assumes additional sales mean customer acquisition improved. Check it. Separate new and returning customers. Shopify's current customer reporting provides information around new and returning customers, order behavior and expected purchase value.
Suppose additional revenue came almost entirely from first-time buyers. That suggests acquisition played an important role. Now investigate which sources introduced those customers.
But do not assume all new-customer growth is equally valuable. If the customers were acquired with aggressive discounting or unusually high advertising spend, the economics may look different from the headline revenue growth.
What If Returning Customers Drove the Growth?
This is a completely different story. Imagine traffic is nearly flat. New customer acquisition is unchanged. But returning customers purchase more frequently and generate $25,000 of additional revenue. The store's growth came from its existing customer base.
Possible explanations include: Better retention. Successful email or SMS campaigns. A replenishment cycle. New products appealing to previous customers. Improved availability. Seasonal repeat buying. A loyalty initiative.
Do not just celebrate a higher returning-customer percentage. Check the absolute number of returning customers, their orders, and the revenue they generated. A percentage can rise simply because new-customer activity weakened.
Channel Mix Can Change the Quality of Growth
A store may grow because one channel becomes more important. Suppose total revenue rises 20%. Organic search contributes +$8,000. Email contributes +$7,000.
Paid social contributes +$15,000. Direct and referral channels decline by $5,000 combined. Your net growth is still positive, but the source of growth is concentrated. Now ask:
- How expensive was the paid growth?
- Did those customers place larger or smaller orders?
- Were they mostly new customers?
- Are they likely to return?
Did the channel cannibalize demand that might have arrived elsewhere? Channel contribution matters because total revenue alone cannot tell you whether your acquisition mix became stronger or more expensive.
Be Careful With Marketing Attribution
This is where growth analysis can become misleading. A marketing platform may say that Campaign A generated 500 sales. That does not automatically mean those 500 purchases would have disappeared without Campaign A.
Attribution determines how conversion credit is assigned across touchpoints. It is not the same thing as proving incremental causation. Google Analytics currently supports comparing attribution models and explains that different models can assign different amounts of credit to the same marketing touchpoints.
This matters because a customer may interact with search, email, social media and direct traffic before eventually purchasing. When sales grow after a campaign launches, use attribution as evidence about the customer journey. Do not automatically treat attributed revenue as scientifically proven incremental revenue.
How Can You Tell Whether a Campaign Really Caused the Growth?
Start with timing and contribution.
- Did performance change when the campaign started?
- Did the promoted products grow more than non-promoted products?
- Did targeted traffic increase?
- Did conversion or AOV change?
- Did new customers increase?
- Did the results remain stronger after the campaign ended?
For stronger causal evidence, controlled experiments or holdout groups are more informative than ordinary attribution reporting when they are practical. Without an experiment, use careful language.
Instead of: The campaign caused $50,000 of growth. Say: The campaign period coincided with $50,000 of attributed revenue and a meaningful increase in the promoted products and target audience. That statement separates evidence from assumption.
Discounts Can Make Growth Look Better Than It Is
Suppose orders increase 30%. Great. But the business used a 25% discount to produce those additional purchases. Revenue grows only 12%. Gross profit may grow even less. This does not mean the promotion failed.
It means order growth and economic growth are not the same thing. If reliable product costs are available, review profit as well. Shopify's current profit reports can show costs, margins, and gross profit when cost-per-item data has been recorded. A useful growth analysis therefore asks:
- Did revenue grow?
- Did order volume grow?
- What happened to AOV?
- What happened to discounts?
- What happened to gross profit?
The further you move from revenue into economics, the better you understand whether the growth was actually valuable.
Fewer Refunds Can Also Improve the Final Result
Not every increase comes from generating more demand. Sometimes the business simply loses less revenue after purchase. Imagine gross sales are almost unchanged but refunds decline significantly. Net retained sales improve.
From the customer's perspective, fewer returns or refunds may also signal better product fit, stronger expectations or improved fulfillment.
Check whether lower refund activity is concentrated around particular products. If one previously problematic product improved significantly, that may explain part of the growth in retained revenue.
A Simple Way to Read Common Growth Patterns
| What Changed? | Likely Area to Investigate |
|---|---|
| Revenue up, orders up, AOV stable | More completed purchases |
| Revenue up, orders stable, AOV up | Larger or higher-value baskets |
| Traffic up, conversion stable | Acquisition or visibility |
| Traffic stable, conversion up | Store or purchase-journey improvement |
| Returning-customer revenue up | Retention or repeat purchasing |
| One product creates most growth | Product-specific demand or availability |
| Revenue up after restock | Inventory constraint removed |
| Orders up strongly, revenue rises less | Discounting or lower-value product mix |
| Gross sales stable, net revenue improves | Fewer refunds or reversals |
| Marketplace revenue rises while site is flat | Channel-mix shift |
Treat this as an investigation map, not proof of causation.
Is the Growth Broad or Concentrated?
This is one of the best questions to ask before deciding whether growth is healthy. Broad growth might mean: Multiple major products improved.
Several acquisition channels contributed. Both new and returning customers grew. Orders and AOV both improved moderately. Several markets performed better. Concentrated growth might mean:
- One campaign.
- One product.
- One marketplace.
- One large customer.
- One promotion.
- One viral post.
- Both types can be positive.
But concentrated growth creates more dependency. If one product produced 70% of your incremental revenue, protect its inventory and investigate why it improved before assuming the entire store has entered a new growth phase.
Is the Growth Repeatable?
Once you know what drove growth, ask whether the driver can continue. Traffic from improved organic rankings may continue.
A temporary influencer mention may not. A higher conversion rate after fixing checkout friction could persist. A one-week flash sale probably will not. A returning bestseller staying in stock can sustain revenue if replenishment remains reliable.
One enterprise-size order may never repeat. Classify your growth drivers mentally into three categories:
- Structural: Improvements that can continue, such as better conversion or stronger retention.
- Scalable: Drivers you may be able to expand, such as a profitable acquisition channel.
- Temporary: One-time events, promotions or unusual orders.
That classification is more useful than simply forecasting the latest growth percentage forward.
Do Not Assume Every Growth Driver Should Be Scaled
Suppose paid advertising produced most of your incremental sales. The automatic response may be: Increase the budget.
Before doing that, check whether the additional customers were profitable enough, whether conversion remained stable as spend increased and whether inventory can support further demand.
Likewise, if one product created rapid growth, more promotion may not be sensible if it has only five days of inventory remaining. The best next action is not always to amplify the thing that grew. Sometimes it is to protect the system around it.
A Practical Ecommerce Growth Investigation
Imagine monthly revenue rises from $240,000 to $288,000. That is $48,000 of additional revenue. You investigate. Traffic increased 6%. Conversion improved from 2.8% to 3.0%. AOV increased slightly. Then product analysis shows two items contributed $31,000 of the $48,000 increase.
Both products were unavailable for much of the previous month but fully stocked this month. Returning-customer revenue also increased because previous buyers purchased those products again. Now the growth story is much clearer.
- It was not simply: Marketing improved.
- It was: Revenue grew primarily because two commercially important products returned to full availability, allowing existing traffic and returning customers to purchase them again. Higher traffic and slightly stronger conversion provided additional growth.
That conclusion leads to useful action. Protect replenishment on those products. Review what drove the smaller traffic increase. Monitor whether conversion remains stronger. Do not automatically double ad spend.
Build a Growth Bridge Every Time Sales Move Meaningfully
When sales increase enough to matter, use the same investigation order:
- Confirm the comparison and calculate incremental revenue.
- Separate order-volume growth from AOV growth.
- Check acquisition or marketplace visibility.
- Examine conversion and the purchase journey.
- Identify products contributing most to the increase.
- Check whether inventory changed the opportunity to sell.
- Separate new and returning customer contribution.
- Review channel and campaign contribution.
- Check discounts, refunds and profit where reliable data exists.
- Decide whether the main drivers are structural, scalable or temporary.
You do not need to complete all ten stages every time. Stop once the major contributors become clear enough to guide the next decision.
The Same Analysis Works Across Ecommerce Platforms
The exact reports will differ across Shopify, WooCommerce, BigCommerce, Adobe Commerce, Wix, Squarespace, Ecwid, PrestaShop, Shopware, Amazon, Etsy, eBay and other or custom ecommerce stores.
Direct-store businesses can often examine sessions, conversion funnels and customer journeys in greater detail. Marketplace sellers may rely more heavily on impressions, listing visits, orders, advertising and marketplace-specific performance metrics.
The analytical question remains consistent: What changed between the old revenue level and the new one? Break the growth into its components rather than treating the store-wide percentage as the explanation.
Where Statty AI Fits
Growth analysis becomes more difficult when sales, customers, products, inventory, and other performance information need to be interpreted separately.
Statty AI is designed to provide a connected ecommerce intelligence environment across Shopify, WooCommerce, BigCommerce, Adobe Commerce, Wix, Squarespace, Ecwid, PrestaShop, Shopware, Amazon, Etsy, eBay and other or custom stores.
The goal is to help merchants move from: Sales increased to: These are the customers, products, inventory conditions and performance changes associated with that growth.
You can explore Statty AI analytics features or visit Statty AI to see how connected store intelligence can support this type of analysis.
For a broader framework around deciding which numbers deserve attention in the first place, see Your Store Has Plenty of Data: Which Numbers Actually Matter?.
Final Thoughts
Higher sales are an outcome. They are not the explanation. When revenue grows, break the increase apart. Determine how much came from additional orders and how much came from higher order value.
Then investigate traffic, conversion, customers, products, channels, inventory, discounts and refunds only where the evidence points. Most importantly, distinguish between growth that happened and growth you understand well enough to repeat. A store that knows revenue increased 25% has a positive result.
A store that knows which customers bought more, which products created the increase, which channels contributed, whether inventory enabled the growth, and which drivers are likely to continue has something much more valuable. It has a growth model it can actually make decisions from.