Data Becomes Useful Only When It Has Context
A number on its own rarely tells you enough. Imagine your store generated $40,000 this month. Is that good? You cannot answer until you know what happened last month, whether this month included a major promotion, whether order volume changed and whether more of that revenue was later refunded.
The same applies to nearly every ecommerce metric. A 20% increase in orders may look impressive until you discover that average order value fell sharply. A product may appear to be losing demand until you realise it was unavailable for a week. Returning-customer revenue may look stable while the number of active returning buyers is shrinking.
Context changes the meaning of the number. That is why good ecommerce analytics usually begins with comparison. The right comparison might be this week versus last week, this month versus the previous month or one campaign against a similar campaign. Without that context, merchants can easily react to normal variation as though something is wrong.
Ask a Business Question Before Opening Reports
One of the easiest ways to waste time with analytics is to start browsing dashboards without knowing what you are trying to understand. Instead, begin with a question. You might ask:
Why did revenue fall even though orders remained stable?
Or:
Why are returning customers generating less revenue this month?
Or:
Which products should we restock first?
These questions immediately narrow the investigation. If you are investigating a revenue decline, you probably need to look at orders, average order value, product performance, customer mix and refunds.
If you are deciding what to restock, you need sales velocity, product revenue, remaining stock and recent demand. If you are trying to understand retention, you need returning-customer behaviour rather than a long list of unrelated sales metrics.
Analytics becomes more useful when every report you open has a reason. For a broader explanation of the different data sources behind these decisions, see our guide to ecommerce data analytics.
Look for the Story Behind the Result
Suppose revenue falls by 10%. That result does not tell you what to do. You investigate further and find that order count fell by only 1%, but average order value dropped significantly. Now you know that the issue is probably not a major decline in transactions.
Next, you review product performance and discover that several premium products generated much less revenue than usual. Inventory data then shows that two of those products were out of stock for several days. The picture is now much clearer. The original result was:
Revenue declined.
The actual business story may be:
Customers continued placing orders, but fewer high-value products were available, so average order value fell.
That leads to a very different decision from simply increasing advertising. The better first action may be to improve product availability. This is the real work of ecommerce analytics: moving from a result to a plausible explanation.
Do Not Treat Every Change as a Problem
Online store performance moves constantly. One bad day does not necessarily mean the business is declining. One unusually strong day does not necessarily mean a strategy is working. Before taking action, ask whether the movement is large enough and consistent enough to matter.
A small decline in conversion over one afternoon could be normal variation. The same decline continuing for three weeks deserves more attention. A product suddenly doubling in sales may look like a trend until you discover that one customer placed a large wholesale-style order. Good analytics separates noise from patterns.
The easiest way to do this is to compare multiple periods and understand what normal performance looks like for your store. Over time, you may learn that Mondays are consistently weaker than Fridays, that returning customers purchase more near payday or that abandoned checkouts increase during certain promotional campaigns. Those patterns create a baseline. Once you know your normal behaviour, unusual movements become easier to identify.
Break Broad Results Into Smaller Groups
Store-wide averages can hide what is really happening. Imagine total customer revenue increased by 9%. That sounds positive. But when you divide customers into groups, you discover that new-customer revenue increased significantly while returning-customer revenue declined.
Now the business situation looks different. Growth may be coming from acquisition while retention is weakening. The same principle applies to products. Overall product revenue may look stable, but one category may be growing while another is falling.
Refunds may look normal overall but be concentrated around one particular product. Checkout abandonment may appear stable overall while mobile shoppers are struggling more than desktop shoppers. Whenever a broad number feels unclear, break it into meaningful groups. Segmentation often turns a vague observation into something a merchant can actually work on.
Connect Data That Belongs Together
Many poor ecommerce decisions happen because related metrics are reviewed separately. Product performance belongs with inventory. Revenue belongs with orders and average order value. Customer counts belong with customer revenue. Checkout abandonment belongs with checkout recovery. Sales belong with refunds and returns. Consider inventory again. A product has ten units remaining.
Is that a problem?
You cannot answer without knowing how quickly it sells. If it sells one unit every month, ten units may be more than enough. If it sells five units per day, the same stock level deserves immediate attention. The inventory number did not change. The context did. That is why ecommerce analytics should help you connect related areas instead of forcing you to interpret separate reports one at a time.
Rank Problems by Impact, Not by Visibility
Dashboards are good at making issues visible. They are not always good at telling you which issue matters most. Imagine that during one review you find:
Several missing meta descriptions
A high-revenue product close to stockout
A small increase in refunds
A drop in checkout recovery
Lower returning-customer revenue
Trying to solve everything immediately is usually unrealistic. Instead, think about business impact.
Ask: Which issue could affect the most revenue or customers?
Then ask: How urgent is it?
A best-selling product likely to go out of stock tomorrow may need attention before a low-impact SEO issue. A large increase in refunds around one product may deserve investigation before a small decline in an insignificant product category. Prioritization is one of the most important parts of turning analytics into decisions because resources are always limited.
Turn the Insight Into a Specific Action
An insight is useful only when it changes what you do. Consider this conclusion: Returning-customer activity is declining. That is useful information, but it is still not an action. A stronger next step might be:
Identify previously active customers who have not purchased recently and test a targeted re-engagement campaign.
Or:
Review whether repeat-purchase products have experienced stock, pricing or fulfillment changes.
The action should directly relate to the evidence. Another example:
Insight: One high-revenue product repeatedly goes out of stock. Action: Review recent sales velocity and raise its reorder threshold.
Another:
Insight: Refunds increased significantly for one product. Action: Review its product description, customer feedback and recent fulfillment issues before promoting it further.
Clear actions are easier to measure than vague goals such as “improve performance.”
Measure What Happened After the Decision
Analytics should not stop after an action is taken. Suppose you raise the reorder threshold for a strong-selling product because repeated stockouts appear to be affecting revenue. After the change, review:
Product availability
Units sold
Product revenue
Stockout frequency
Average order value
If those metrics improve, your decision may have addressed the right problem. If nothing changes, revisit your original assumption. Perhaps stock availability was not the main cause after all. This creates a useful decision loop:
Observation → Investigation → Action → Measurement
Over time, this process helps you learn which decisions actually work for your store instead of relying on assumptions.
Use a Decision Log Instead of Relying on Memory
Store owners and teams often make dozens of changes every month. A promotion launches. Pricing changes. Inventory thresholds move. Email campaigns change. Product pages are updated. Weeks later, performance changes and nobody remembers exactly what happened beforehand. A simple decision log can solve this.
For each meaningful change, record the date, the data that triggered the decision, the action taken and the result you expected. For example:
Observation: Checkout recovery declined for three consecutive weeks.
Decision: Test a revised recovery message.
Expected result: More abandoned customers return and complete checkout.
Review: Compare recovery performance after two weeks.
This creates a history of why changes were made. Your analytics then becomes more than a dashboard. It becomes part of an ongoing learning process.
Know the Difference Between Evidence and Assumption
Analytics can show patterns, but patterns do not always prove causes. Imagine abandoned checkout activity increases after you change shipping rates. Those two events happening together are important. But the analytics alone may not prove that shipping costs caused the increase.
You may need additional evidence from customer messages, support conversations, checkout testing or surveys. A strong ecommerce decision should therefore separate:
What the data clearly shows
from:
What you currently believe may explain it
This makes your analysis more realistic and reduces the risk of making expensive decisions from weak evidence.

Where AI Fits Into Ecommerce Decision-Making
AI can make analytics faster when it helps merchants connect related store information. Instead of manually checking several reports, a merchant may ask:
Which factor contributed most to this week’s revenue decline?
Or:
Which strong-selling products are currently at risk from low stock?
Or:
Did returning customers or new customers drive this month’s growth?
An AI system grounded in the store’s actual data can summarize relevant metrics and provide a starting point for investigation. The important word is starting point.
AI should help explain the data, not pretend that every pattern is a proven cause. The merchant still needs to consider business context, promotions, customer feedback, market changes and information that may not exist inside the analytics platform.
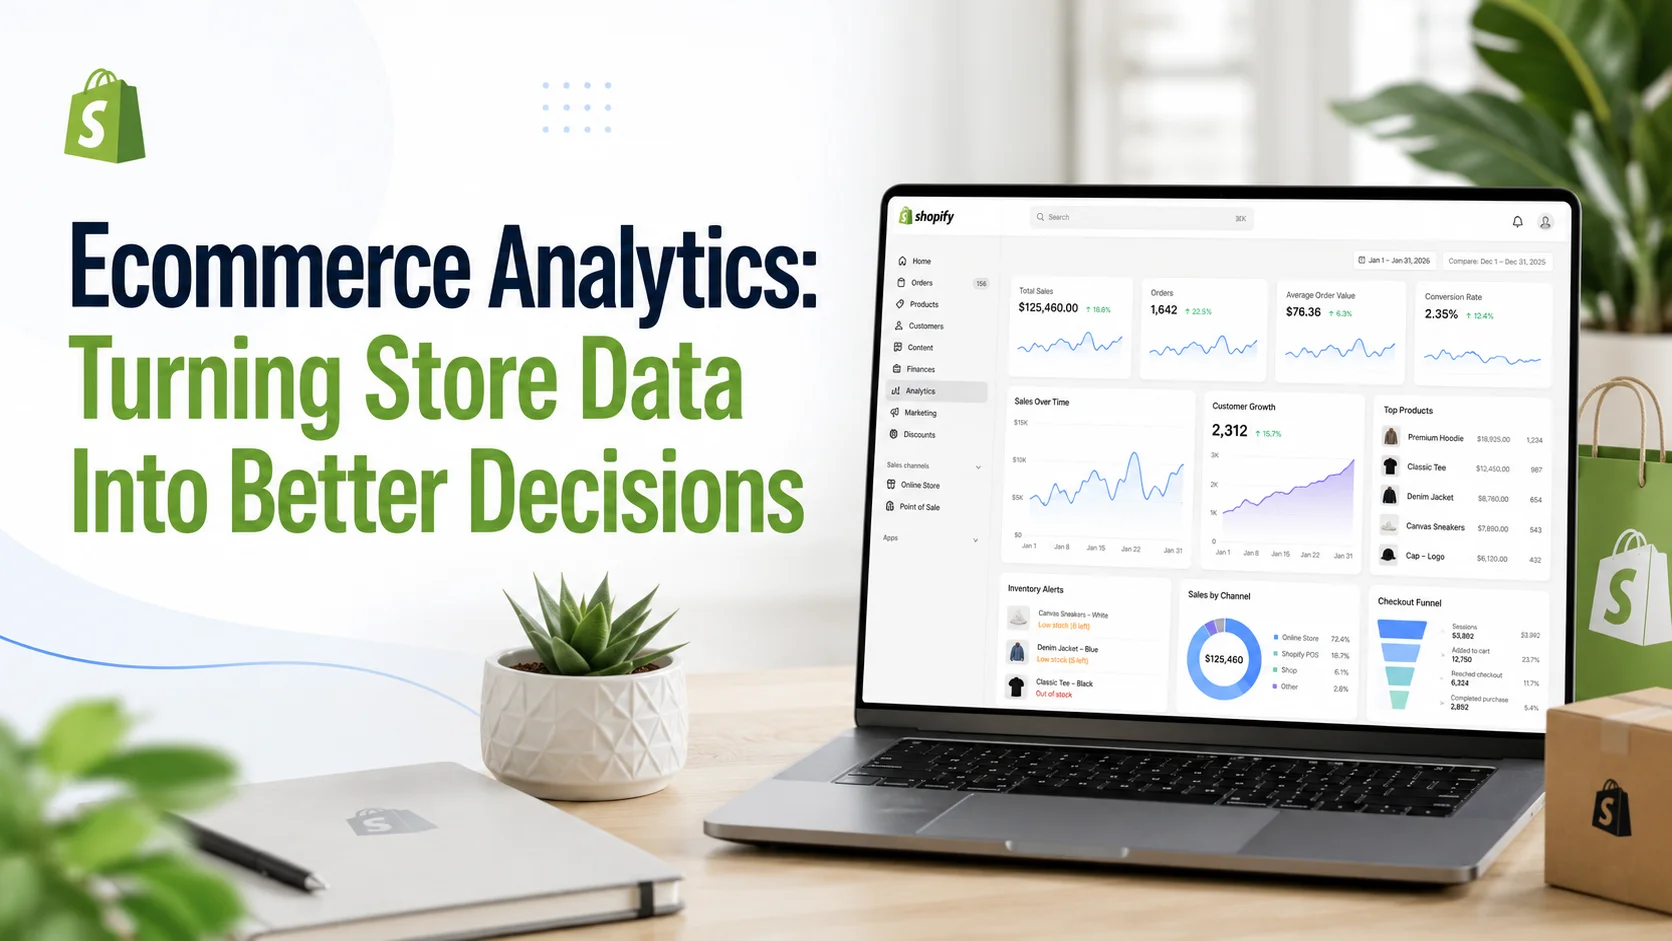
Statty AI brings sales, customer, product, inventory, checkout, store-health and SEO information together in one Shopify analytics dashboard, with AI-powered explanations designed to make important changes easier to investigate.
Build a Weekly Decision Routine
A useful weekly analytics review does not need to involve dozens of reports. Start by identifying the most meaningful changes from the previous period. Choose the one or two changes with the greatest potential impact.
Investigate the related metrics and decide whether there is enough evidence to act. Then choose a specific action and decide how you will measure the result. That creates a simple weekly workflow:
Find the signal → understand the context → choose the action → measure the outcome.
This is much more useful than spending an hour reading charts without leaving with a decision.
Better Analytics Means Better Questions
The biggest improvement most merchants can make is not collecting more data. It is asking better questions.
Instead of: How much revenue did we generate? Ask: What contributed most to the revenue change?
Instead of: Which product sells the most? Ask: Which products are driving revenue and which of them are at inventory risk?
Instead of: How many customers returned? Ask: Which returning customers are becoming more or less valuable?
Instead of: Is checkout abandonment high? Ask: Has abandonment changed, and are we recovering enough of those checkouts?
That is how ecommerce analytics moves from data to decisions. Data tells you what happened. Good analysis gives it context. A good decision turns that context into an action you can test and measure.
For merchants who want these areas connected in one place, explore the AI-powered Shopify analytics app from Statty AI or review its complete analytics and AI features.