Imagine your analytics system tells you that a product is likely to sell 1,800 units next month.
Should you order 1,800 units?
Probably not yet.
Before acting, you need to know how the forecast was produced, how much historical data it used, whether the product is seasonal, whether a promotion is planned, whether recent stockouts distorted past demand, and how uncertain the estimate actually is.
This is the part of predictive analytics in ecommerce that often gets lost behind impressive dashboards and AI language.
Predictive analytics can be extremely useful. It can help merchants estimate future demand, identify inventory risk, project sales trends and assess the probability of certain customer behaviors. But a prediction is not a fact about the future.
It is an estimate based on patterns, assumptions and the information available when the model was built. The practical value comes from knowing both what predictive analytics can help you estimate and what its limitations are before you make a decision.
What Is Predictive Analytics in Ecommerce?
Predictive analytics uses current and historical data, statistical techniques and machine learning models to estimate future outcomes.
IBM defines predictive analytics as the use of historical data together with statistical modeling, data mining and machine learning to predict future trends and outcomes.
In ecommerce, that can mean estimating questions such as:
Will demand for this product rise next month?
How much revenue might the store generate next quarter?
Which products are at higher risk of stocking out?
Which customers are more likely to purchase again?
Which customer relationships appear more likely to become inactive?
The key word is likely. Predictive analytics estimates probability or expected values. It does not know what will happen with certainty.
How Is Predictive Analytics Different From Ordinary Ecommerce Analysis?
Ordinary analytics often looks backward. You might ask:
How much did we sell last month?
Why did revenue decline?
Which product lost the most sales?
Did returning customers become less active?
Predictive analytics asks a different type of question: What is likely to happen next if the patterns in our data remain relevant?
That distinction matters. Descriptive analysis may tell you that Product A sold 900 units last month. Diagnostic analysis may show that sales increased after a promotion.
Predictive analysis might estimate future unit demand based on historical sales, seasonality, promotions and other variables.
Forecasting therefore does not replace descriptive or diagnostic analysis. It depends on them.
If you do not understand what happened in the historical data, it becomes much harder to judge whether a future prediction makes sense.
For a broader explanation of how different kinds of ecommerce data can support forecasting, see Big Data Analytics in Ecommerce.
What Is the Difference Between Prediction and Explanation?
A prediction estimates a future outcome. An explanation describes the evidence or relationships associated with an observed or predicted result.
Suppose a model forecasts that next month's sales will be 12% higher. That is a prediction.
If the system also tells you that the forecast reflects recurring seasonal demand, recent growth and an upcoming promotion included in the model, that provides context for the forecast. But even that explanation does not guarantee the outcome.
A competitor may launch a major campaign. Your bestselling product may become unavailable.
A marketplace policy may change. A viral post could increase demand unexpectedly.
Forecasting works from available information. The future can introduce information that did not exist when the prediction was made.
What Can Ecommerce Businesses Forecast?
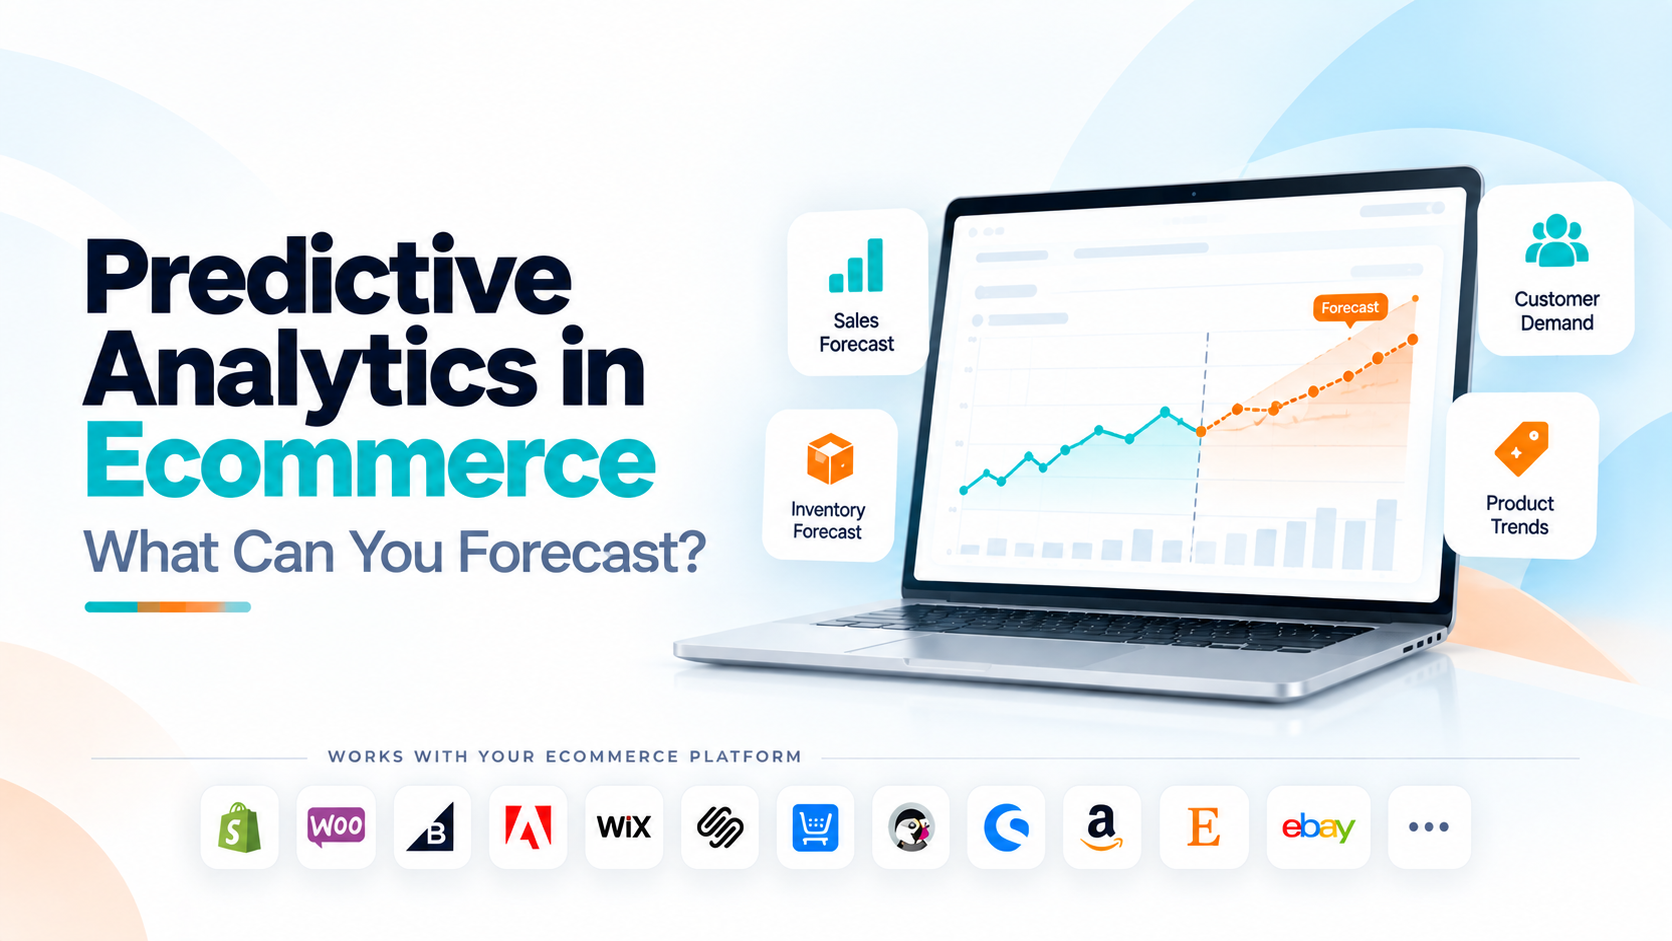
The most useful forecasts usually focus on outcomes where historical patterns have some relationship with future behavior. For ecommerce businesses, that commonly includes demand, sales, inventory requirements and customer behavior.
Not every prediction needs an advanced neural network. Sometimes a well-designed time-series model or even a simple seasonal baseline performs well. The correct model depends on the question and the data available.
IBM notes that forecasting methods range from moving averages and exponential smoothing to ARIMA and machine learning techniques. The choice depends on the business objective, dataset and complexity of the patterns involved.
Demand Forecasting: How Much Might Customers Buy?
Demand forecasting is one of the clearest ecommerce applications.
A merchant may want to estimate how many units of each product customers are likely to purchase during the next week, month or quarter. A basic model might use historical unit sales.
A more advanced forecast might also consider: seasonality, promotions, product prices, holidays, recent demand changes and other relevant variables.
AWS describes retail demand forecasting as using historical data alongside variables such as seasonality, promotions, inventory levels and market trends to estimate future consumer demand.
The purpose is not simply to produce a future number. It is to help purchasing and inventory teams plan with more information than: "We sold 500 last month, so let's order another 500."
Why Historical Sales Are Not Always the Same as Historical Demand
This distinction is critical. Suppose Product A normally sells 20 units per day. It goes out of stock for ten days. Your monthly record now shows fewer units sold.
Does that mean customer demand fell?
Not necessarily. Customers may have wanted to buy the product but could not. A forecasting model trained only on completed sales can therefore underestimate demand when inventory constraints are not accounted for.
Promotions can create a similar problem in the opposite direction. If a one-time 40% discount caused an unusual sales spike, the model should not blindly assume that the same demand will continue under normal pricing.
Historical data needs business context. Past sales are observations of what happened under particular conditions. They are not always a perfect measurement of unconstrained demand.
Can Predictive Analytics Help Prevent Stockouts?
It can help estimate stock risk, but a demand forecast alone is not enough. Suppose a model predicts approximately 600 units of demand over the next 30 days. You currently have 700 units.
At first, inventory looks safe. But your next supplier shipment takes 45 days to arrive. Now the situation looks different. Stock risk depends on several pieces of information working together: current inventory, expected demand, replenishment lead time, incoming stock and uncertainty in the forecast.
The prediction helps estimate demand. Inventory data and operational constraints determine whether that forecast creates a risk. This is why predictive ecommerce insights become more valuable when they are connected with real operational information rather than shown as an isolated forecast line.
Can You Forecast Ecommerce Sales and Revenue?
Yes, sales and revenue are common forecasting targets. Time-series forecasting uses historical observations to estimate future values by learning patterns such as trends and seasonality.
Google Cloud describes time-series forecasting as modeling historical time-based data to make predictions about future points, while noting challenges including seasonality, holiday effects, data sparsity and changing trends.
A sales forecast may use: historical revenue, recent trend, weekday patterns, annual seasonality, campaigns or other explanatory variables. But merchants should be careful about treating the result as a target.
A forecast answers: What might happen based on the model and its assumptions?
A target answers: What do we want to achieve?
Those are not the same thing.
What Does Seasonality Do to an Ecommerce Forecast?
Seasonality describes patterns that repeat on a regular schedule. An ecommerce business may experience: weekend demand changes, monthly purchasing cycles, summer demand, Black Friday peaks or recurring holiday sales.
A forecasting model needs enough historical information to distinguish recurring seasonal behavior from a one-time spike.
Microsoft's current forecasting guidance notes that insufficient historical data can make it difficult to distinguish a true recurring seasonal pattern from a one-time event. Its example explains that two years of history can provide one seasonal cycle to learn from and another to validate against.
That does not mean every ecommerce forecast requires exactly two years of data.
The required history depends on the pattern being modeled.
If you are forecasting weekday demand, several weeks may reveal something useful.
If you want to understand annual Christmas seasonality, one year gives you only one Christmas.
The longer the seasonal cycle, the more historical context usually becomes valuable.
How Much Historical Data Do You Need?
There is no universal minimum. The answer depends on the forecast horizon, seasonality, transaction volume, product lifecycle and how stable the underlying business is.
A mature bestseller with three years of regular sales history provides a very different forecasting problem from a product launched two weeks ago. This is known as a cold-start problem.
A new product has little or no product-specific history, so a model may need to rely on related products, category behavior, product attributes or broader business information. Even a large dataset can be unhelpful if it reflects a business that no longer exists.
Three years of historical data from an old pricing strategy, different product range and different customer market may not automatically be more useful than recent relevant data. Quality and relevance matter alongside quantity.
Can Predictive Analytics Forecast Customer Behavior?
It can estimate probabilities around certain behaviors when suitable customer history exists. For example, a model may estimate:
likelihood of repeat purchase,
probability of becoming inactive,
expected future customer value,
likelihood of purchasing a particular category.
But these should be interpreted as probabilities, not labels that define a person. A customer predicted to have an 80% chance of purchasing again can still never return. A supposedly low-value customer can become one of your strongest buyers.
Customer circumstances change.
Competitors change.
Needs change.
Predictive customer analytics improves decision-making under uncertainty. It does not remove uncertainty.
This is especially important when predictions influence discounts, retention campaigns or customer treatment. For understanding the historical customer signals that sit behind these models, see Ecommerce Customer Analytics.
Why Should a Forecast Show a Range Instead of One Perfect Number?
Because the future is uncertain. Suppose a model predicts next month's revenue at exactly $250,000. That looks precise. But a more useful forecast may say:
Expected value: $250,000
Likely range: $225,000 to $278,000
The range communicates uncertainty.
Microsoft's forecasting documentation describes confidence intervals as ranges within which the algorithm expects the actual value to fall given variability in historical data. Higher confidence generally produces a wider interval.
For business decisions, that range can be more valuable than the central estimate. If inventory planning works only when demand is exactly 1,000 units, the plan is fragile.
If the forecast range suggests demand could reasonably reach 1,300 units, management can decide how much safety stock or flexibility is justified.
Prediction Intervals Should Influence the Decision
Imagine two products both have expected demand of 500 units.
Product A forecast range: 470 to 530
Product B forecast range: 300 to 750
The central prediction is identical. The uncertainty is completely different. Product B may need a more cautious inventory strategy because the model is much less certain.
This is why predictive analytics should not reduce every forecast to one number. A good decision considers both: expected outcome and uncertainty around that outcome
What Happens When the Business Changes?
Predictive models learn from historical relationships. Those relationships do not remain stable forever.
Customer preferences change.
Prices change.
The catalog changes.
New competitors appear.
Economic conditions change.
A marketplace modifies its algorithm.
A product becomes viral.
When incoming data starts behaving differently from the data used to build a model, the model can become less reliable. This problem is commonly discussed as data drift or model drift.
Google Cloud describes drift as the situation where production data changes from the baseline or training data, which can make previously relevant model inputs less useful for current predictions.
Its model monitoring tools are designed to detect these changes so models can be re-evaluated or retrained. A forecast should therefore not be built once and trusted indefinitely.
What Is Model Drift in a Real Ecommerce Store?
Imagine a customer-repeat-purchase model was trained when your store mainly sold skincare products. Customers typically reordered every two months. A year later, the business expands heavily into furniture.
Furniture customers naturally purchase less frequently. The old relationship between purchase frequency and customer value may no longer behave the same way. Or imagine a demand model learned from three years of full-price sales.
The company then changes to an aggressive subscription model.
The old demand patterns may be less useful.
The model has not necessarily "broken."
The business environment changed.
Predictive systems need monitoring because the data-generating process itself can move.
How Should You Measure Forecast Accuracy?
Do not evaluate a forecast because one prediction looked impressive. Compare forecasts with what actually happened over repeated periods.
Forecasting systems commonly use error measures such as mean absolute error, root mean squared error or percentage-based measures, depending on the problem. The specific metric matters less to a store owner than the habit: forecast, observe, measure the error, then improve the model.
A forecast that repeatedly misses demand by 30% should not receive the same trust as one that usually stays within a much narrower error range.
Accuracy should also be evaluated at the level where the decision happens. A forecast may be accurate for total store revenue while performing poorly for individual SKUs. If the decision is inventory purchasing by SKU, the SKU-level accuracy matters more.
Why One Forecasting Model Is Not Always Best for Every Product
Products behave differently.
A mature staple product may have stable recurring demand.
A fashion product may have a short lifecycle.
A holiday product may sell mainly during a few weeks each year.
A newly launched item has little historical data.
A viral product may experience sudden growth that historical models could not anticipate.
Using the same forecasting logic blindly across every SKU can therefore produce poor results. More sophisticated forecasting systems evaluate different model types or group products with similar characteristics.
The important question is not: Which forecasting algorithm is the most advanced?
It is: Which approach performs reliably for the business decision we actually need to make?
Why Predictions Become Less Reliable Farther Into the Future
Forecast uncertainty generally increases as the forecast horizon becomes longer. Predicting tomorrow's sales may rely heavily on very recent patterns.
Predicting sales twelve months from now requires far more assumptions about demand, pricing, competition, products, marketing and the wider market.
That does not make long-term forecasting useless. It changes how the forecast should be used. Shorter-term forecasts can support operational decisions.
Longer-term forecasts may be better suited to scenarios and planning ranges rather than precise commitments.
When management sees a twelve-month forecast displayed as a perfectly smooth line, it should ask how uncertainty expands across that horizon.
Should You Trust AI Predictive Analytics More Than Traditional Forecasting?
Not automatically. AI and machine learning can analyze larger datasets and more complex relationships than simpler statistical methods, but complexity does not guarantee better forecasts.
IBM notes that model selection should depend on the objective, data quality, volume and complexity of the relationships being forecast. Models should also be trained and validated against historical outcomes before being trusted for future periods.
An advanced machine learning model trained on poor data can perform worse than a simpler method based on clean, relevant history.
The correct comparison is not: AI versus non-AI.
It is: Which method produces reliable forecasts for this specific decision?
What Should You Never Trust Blindly?
Do not trust a prediction blindly when the system does not tell you what data was used.
Do not assume a forecast is reliable simply because the number has several decimal places.
Do not treat a point prediction as certainty when the model has significant uncertainty.
Do not use historical demand without checking for stockouts, discontinued products, promotions or major operational changes.
Do not assume customer probabilities describe individual people perfectly.
Do not keep trusting a model after the business environment has changed substantially.
And do not automate expensive decisions unless forecast accuracy and business risk justify that level of automation. Predictive analytics should make uncertainty easier to manage. It should not hide uncertainty behind confident-looking numbers.
Where Human Judgment Still Matters
A forecasting model may see that demand is falling. A merchant may know a major campaign launches next week. The model may predict a stockout. The purchasing manager may know that an emergency shipment is already confirmed. A customer model may identify declining engagement.
The business may know that its buying cycle is naturally seasonal. This is why experienced decision-makers remain important. Predictive systems analyze patterns in the information they receive. Humans often know about planned events, operational constraints and strategic decisions that are not yet represented in historical data.
The strongest workflow combines both.
The model estimates what the data suggests.
The human asks whether the assumptions still make sense.
Where Statty AI Fits
Statty AI currently focuses on connected ecommerce analytics and AI-assisted interpretation of available commerce data, including sales, customers, products, inventory, refunds and operational performance. Its current public positioning emphasizes identifying meaningful changes, asking questions about connected data and understanding where deeper investigation may be needed.
This article explains predictive analytics as an ecommerce discipline. It should not be read as a claim that every forecasting capability discussed here is currently available in Statty AI. That distinction matters. Describing historical performance clearly and forecasting future outcomes are different analytical capabilities.
If a product currently helps merchants understand what changed in connected store data, that capability should not automatically be marketed as demand forecasting, churn prediction or predictive inventory planning unless those models actually exist and have been validated.
You can explore the current Statty AI analytics capabilities through Statty AI Features. For the related question of how AI can reason over actual connected ecommerce data without pretending to know more than the evidence supports, see Commerce AI in Ecommerce Analytics.
Final Thoughts
Predictive analytics in ecommerce can make planning much more informed.
It can help estimate product demand.
It can support sales and revenue forecasting.
It can highlight potential inventory risk.
It can estimate probabilities around customer behavior.
It can help businesses prepare before an outcome becomes visible in ordinary reports.
But every prediction sits on top of assumptions. Historical data must be relevant. Seasonality needs enough history to learn from. Promotions and stockouts need context. New products create cold-start problems.
Uncertainty should be visible. Forecast accuracy needs to be measured. And models need to be monitored as customer behavior and business conditions change.
The right question is therefore not: Can predictive analytics tell us what will happen?
It is: Can predictive analytics give us a useful estimate of what may happen, how uncertain that estimate is, and whether the evidence is strong enough to support the decision we need to make?
That is the difference between using a forecast as a planning tool and treating it like a promise.
FAQ
What is predictive analytics in ecommerce?
Predictive analytics in ecommerce uses historical and current commerce data together with statistical or machine learning models to estimate future outcomes such as demand, sales, inventory requirements or customer behavior. It provides probabilities and forecasts rather than guaranteed future results.
What is the difference between ecommerce forecasting and predictive analytics?
Forecasting is usually focused on estimating future values, often across time, such as next month's sales or product demand. Predictive analytics is broader and can also estimate probabilities, classifications and other future outcomes such as the likelihood of a customer purchasing again.
How much historical data is needed for ecommerce forecasting?
There is no universal amount. The requirement depends on the pattern you are trying to forecast, the forecast horizon, seasonality, order volume and product lifecycle. Longer seasonal patterns usually require more historical cycles, while new products may have very little product-specific history.
Can predictive analytics prevent ecommerce stockouts?
It can help estimate demand and identify inventory risk, but it cannot guarantee that a stockout will not occur. Inventory decisions also require current stock, replenishment lead times, incoming inventory, supplier reliability and forecast uncertainty.
Why can ecommerce forecasts be wrong?
Forecasts can be wrong because historical patterns change, source data is incomplete, promotions distort demand, stockouts hide true demand, unexpected events occur, the selected model is unsuitable or the forecast horizon is too long. Time-series forecasting also has challenges such as seasonality, holidays, sparse data and changing trends.
What is a confidence interval in ecommerce forecasting?
A confidence interval expresses a range around a forecast that reflects uncertainty in the historical data and model. A wider interval indicates more uncertainty. It gives decision-makers more information than relying only on one central prediction.
What is model drift?
Model drift occurs when the data seen after a model is deployed changes from the patterns or distributions the model originally learned. If customer behavior, products, pricing or other business conditions change, model accuracy can weaken and the model may need reassessment or retraining.
Should ecommerce businesses automate decisions from predictive analytics?
Only when the forecast has been validated and the risk of an incorrect decision is acceptable. High-impact decisions such as major inventory purchases or pricing changes should generally keep human review, especially when uncertainty is high or market conditions are changing quickly.