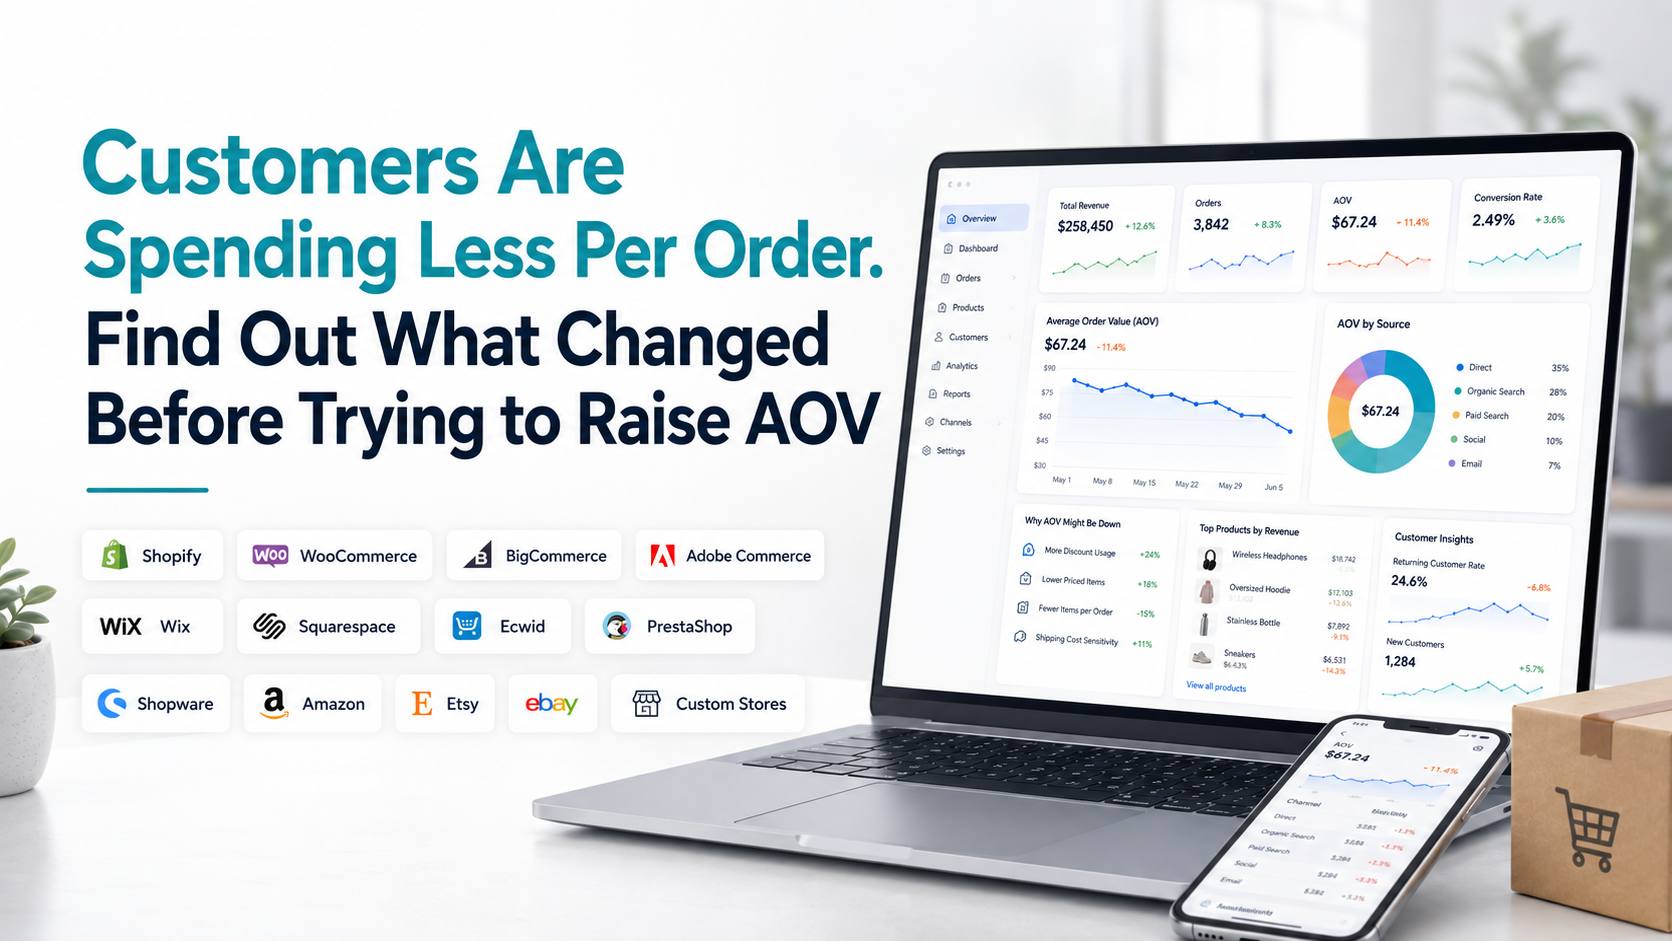
Your store is still receiving orders. Customers are still buying. But when you compare this month with the previous one, the average amount spent on each order has fallen. Maybe average order value moved from $92 to $78.
Perhaps sales are still growing because order volume increased enough to compensate. Or maybe the lower order value has already started pulling revenue down.
The tempting response is to immediately add bundles, upsells, free-shipping thresholds or discounts designed to increase basket size. That might help. But first you need to understand why customers are spending less per order.
An average order value decline is a signal. It does not tell you whether shoppers are purchasing fewer items, buying cheaper products, receiving larger discounts, coming from a different customer group, using a different sales channel, or simply behaving normally for the current season. The first job is diagnosis.
Start by Confirming What Your AOV Actually Measures
Average order value sounds like a universal metric, but platforms do not always calculate it in exactly the same way. Shopify currently defines AOV as gross sales minus discounts, divided by orders, while excluding post-order adjustments such as later edits, exchanges, or returns.
WooCommerce Analytics uses a different definition. Its AOV is net sales divided by orders, and net sales already deduct returns and coupons. That difference matters. Before investigating a decline, confirm that you are comparing the same AOV metric from the same reporting system across equivalent periods.
Do not compare Shopify AOV with a different revenue-per-transaction metric in Google Analytics and assume the numbers should match perfectly. Google Analytics itself distinguishes purchase revenue, gross purchase revenue, purchases, refunds, and other ecommerce metrics. Consistency comes first.
How Much Did AOV Actually Fall?
Calculate both the dollar change and percentage change. Suppose: Previous AOV: $100, Current AOV: $82. The dollar decline is: $18 per order. The percentage decline is: 18%
Now connect that change to order volume. If you process 200 orders per month, an $18 difference represents roughly $3,600 in order-value difference before considering the exact revenue definitions involved.
At 10,000 orders, the same $18 movement becomes commercially much larger. That is why you should not judge the significance of an AOV decline from the percentage alone. Ask: How much order value does the change represent at our current transaction volume?
The Best First Breakdown: Did Customers Buy Fewer Items or Cheaper Items?
A useful way to investigate AOV is to split the problem into two broad possibilities. Customers may be buying: Fewer items per transaction or lower-value items per transaction. Sometimes both happen together.
Shopify's current sales reports include units per transaction, calculated from net quantity divided by total orders, which can help separate basket quantity from monetary order value. This gives you a useful diagnostic relationship:
Order value is influenced by how many items customers buy and how much those items are worth.
If AOV falls while units per order remain stable, the issue is probably not primarily basket quantity. Look at product price, mix, and discounts. If AOV falls and units per order also fall, shoppers may simply be purchasing smaller baskets. Those situations need different responses.
Scenario 1: Customers Are Buying Fewer Items Per Order
Suppose your numbers look like this:
- Previous period: 2.8 units per order, $95 AOV
- Current period: 2.1 units per order, $73 AOV
The reduction in basket size deserves attention. Now investigate what normally causes customers to add that second or third item. Perhaps a bundle ended.
- A complementary product went out of stock.
- A quantity discount disappeared.
- A product recommendation stopped appearing.
- A free-shipping threshold changed.
Customers may also have shifted from large planned purchases toward smaller replenishment purchases. Do not immediately install a new upsell tool. First determine which items disappeared from the basket.
Look at Product Combinations, Not Only Bestsellers
A bestseller report tells you which products sell frequently. It does not necessarily tell you which products help create larger orders. Imagine customers commonly buy: Coffee machine + filters + cleaning tablets
The coffee machine may generate most of the revenue, but filters and cleaning tablets increase basket size. If one of those complementary items becomes unavailable or stops being recommended, the store might continue selling a similar number of coffee machines while AOV declines.
Analyze products that frequently appear in larger orders. Then compare whether those attachments became less common during the period where AOV fell.
- This is a different question from: What is our most popular product?
- You are asking: What normally makes an order larger?
Scenario 2: Basket Quantity Is Stable but Customers Are Buying Cheaper Products
Now imagine:
Units per order: unchangedAOV: down 16%
Product mix becomes the next area to inspect. Suppose customers previously purchased many $150 products. This month, a $60 product becomes your most popular item. Order behavior may be perfectly healthy. The store is simply selling a lower-priced mix.
BigCommerce specifically recommends looking at AOV together with product-level information because product performance can reveal which items are affecting average order value. Compare product revenue contribution between the two periods. Look for:
- High-priced products losing share.
- Lower-priced products gaining share.
- Premium variants selling less.
- Accessories becoming a larger percentage of transactions.
- New lower-priced products generating significant order volume.
The question is not whether cheap products are bad. It is whether the changing product mix explains the lower store-wide average.
Check Whether Premium Products Were Actually Available
A change in product mix does not always mean shoppers suddenly prefer cheaper products. They may simply have fewer premium options available to buy. Imagine your highest-value product has four variants.
Two premium variants sell out. Customers continue purchasing, but they choose the lower-priced option that remains available. Order count may stay relatively healthy while AOV declines.
Shopify product insights currently show product-level net sales, sales over time, sales by channel, and first-time versus returning customer information. Combine that product information with inventory. Ask:
- Were the high-value products available for roughly the same proportion of both periods?
- Did popular premium variants disappear?
- Did customers substitute toward cheaper alternatives?
This is especially important before deciding that your pricing or upsell strategy has stopped working. For deeper inventory analysis, see Shopify Inventory Analytics: What to Track Before Stock Becomes a Sales Problem.
Scenario 3: Discounts Became More Aggressive
Discounting can reduce the amount customers pay for the same basket. Suppose a customer previously purchased: 3 items worth $120.
This month they purchase the same 3 items but receive a $25 discount. Basket quantity is unchanged. Product mix is unchanged. AOV falls.
Shopify's AOV calculation explicitly subtracts discounts, which means heavier discounting can directly reduce reported AOV even when customers buy the same merchandise.
WooCommerce similarly subtracts coupons when calculating net sales, which then feeds into its AOV calculation. Its Analytics environment also provides metrics for discounted orders and discount amounts.
- Compare both: How many orders received discounts?
- And: How much discount value was applied?
AOV can fall because discounts became deeper, because more customers received them, or both.
Do Not Automatically Remove Discounts Because AOV Fell
Discounting should be evaluated against the purpose of the campaign. Suppose AOV falls 12%, but a promotion generates 35% more first-time customers and those customers later make profitable repeat purchases. That may be commercially reasonable.
Now suppose the same promotion reduces AOV, barely changes order volume, and mainly gives discounts to customers who would probably have purchased anyway. That looks much weaker.
- The right question is therefore not: Did discounts reduce AOV?
- It is: What did we receive in exchange for the lower order value?
That might be more customers, faster inventory movement, higher conversion, stronger retention, or nothing meaningful.
Scenario 4: Your Customer Mix Changed
Different customer groups can naturally produce different order values. First-time buyers may start cautiously with one item. Returning customers may know the catalog better and purchase several products. But the opposite can also happen.
A customer's first purchase may be a $120 starter kit, while repeat purchases are $25 refills. There is no rule saying one group must always have higher AOV. The important step is to segment the data. Compare:
- New customer AOV.
- Returning customer AOV.
The share of orders coming from each group. Shopify's analytics currently distinguishes new and returning customers across its reporting and marketing environment. Suppose each group's AOV barely changed.
But the business acquired far more customers from the group that naturally places smaller orders. Your overall AOV declines even though neither customer segment changed its behavior. That is a mix effect, not necessarily a problem.
This Is Why Blended AOV Can Mislead You
Imagine:
- Returning customers average $110 per order.
- New customers average $55.
- Last month:
- 60% of orders came from returning customers.
- This month:
- 70% come from new customers.
Even if both groups maintain exactly the same individual AOV, your blended store AOV will fall. Looking only at the headline figure might make you think every customer is spending less. They are not. The composition of your order base changed. This is why segmentation matters whenever a store-wide average moves significantly.
Scenario 5: A New Marketing Channel Is Bringing Smaller Orders
Acquisition channels can create different buying patterns. Shopify's current marketing reporting includes AOV alongside sessions, conversion, CAC, orders, sales, and new versus returning customers, making it possible to compare customer value across marketing activity.
Suppose your usual organic customers spend around $90. A successful paid social campaign begins generating many $45 introductory purchases. Overall AOV falls. That does not immediately mean the campaign is poor. Check:
- Acquisition cost.
- Conversion.
- New customer volume.
- Repeat purchase behavior.
- Gross margin.
- Products purchased.
A channel producing lower initial AOV can still be valuable if it brings profitable customers into the business. The problem appears when low-value orders also require high acquisition spending and do not develop into stronger customer relationships.
Scenario 6: A Marketplace or New Store Is Changing the Average
The same mix effect can occur across ecommerce channels. Suppose your direct store averages $105 per transaction. Your Etsy or eBay business grows quickly but averages $48. When the data is combined, overall AOV declines even though neither individual channel weakened.
This becomes increasingly relevant for businesses operating across Shopify, WooCommerce, BigCommerce, Adobe Commerce, Wix, Squarespace, Ecwid, PrestaShop, Shopware, Amazon, Etsy, eBay, and custom stores. Do not diagnose a blended AOV decline until you break it down by store or sales channel.
You may discover that: Store A: stable, Store B: improving, Marketplace C: rapidly growing but structurally lower value. The overall average is reflecting business mix rather than deteriorating customer behavior.
Scenario 7: Geography Changed
AOV can also move when your geographic customer mix changes. Imagine one country normally generates larger orders because shipping encourages customers to consolidate purchases.
Another market produces smaller, more frequent orders. If the lower-value market becomes a larger share of total transactions, blended AOV declines.
Currency movement can create additional reporting complexity when international orders are normalized into one reporting currency. Break AOV down by major market where your analytics allows it. Do not change your entire store strategy because a change is concentrated in one region.
Scenario 8: Your Free-Shipping Threshold May No Longer Be Influencing Basket Size
Free-shipping thresholds can influence how customers build baskets. Shopify itself lists AOV as useful when setting minimum thresholds for free-shipping promotions.
Baymard's ecommerce UX research also identifies prominent free-shipping information as an important element that can influence order value and customer decision-making.
Suppose your threshold is $75. A large share of customers historically spent between $70 and $80. Then you remove the threshold and offer free shipping on every order.
Some shoppers who previously added another product to reach $75 may no longer have that incentive. Conversion might improve. AOV might fall. Again, neither result should be interpreted alone. Measure what happened to:
- Conversion.
- Order value.
- Shipping cost.
- Gross profit.
- Customer behavior.
The goal is not maximizing AOV at any cost. It is improving overall economics.
Scenario 9: Bundles or Cross-Sells Stopped Working
AOV can decline because merchandising changed. Check whether anything happened around the same date:
- A bundle ended.
- An upsell was removed.
- A related-product section stopped displaying.
- A product recommendation application changed.
- A theme redesign moved recommendations lower on the page.
- A promotional bundle became less attractive.
One of the bundled products ran out of stock. The timing can provide a useful clue. If AOV declined immediately after a merchandising change, compare basket composition before and after the change. Do not assume correlation proves causation, but it gives you something specific to investigate or test.
Scenario 10: More Orders Are Replenishment Purchases
Lower AOV can be healthy for businesses where customers return frequently.
- Imagine the customer's first purchase is: Starter system: $160
- Later orders are: Replacement product: $32
If retention improves, the business may generate many additional $32 orders. Store-wide AOV falls. Customer lifetime value may still improve. This is why AOV should not be optimized independently from repeat purchasing and customer value.
A consumables business, subscription business, cosmetics brand, or pet-supply store may naturally develop a lower blended AOV as repeat purchase frequency increases. For deeper customer behavior analysis, see Shopify Customer Retention Analytics
.
Average Order Value Can Hide the Shape of Your Orders
An average can move even when the "typical" customer does not change much. Imagine ten orders. Nine customers spend around $50. One customer spends $500. That single large order pushes the average upward substantially.
Next month, the nine $50 customers behave exactly the same, but the $500 customer does not order. AOV falls. Did the typical shopper suddenly spend less?
No. You simply lost one unusually large transaction. This is why mature AOV analysis should consider more than the average itself. If your reporting environment supports it, look at:
- Median order value.
- Order-value bands.
- Number of unusually large orders.
- Percentage of orders above selected thresholds.
- AOV by customer group.
- AOV by channel.
This helps distinguish a broad decline in basket value from the disappearance of a few high-value purchases.
Median Order Value Can Tell a Different Story
Suppose: AOV falls from $105 to $82, Median order value stays around $68. That suggests the center of your order distribution did not move nearly as much as the average. You may have lost some large orders rather than seeing widespread lower spending.
Now reverse it. AOV falls from $105 to $82, Median order value also falls from $72 to $57. The decline appears much broader across customers. Median order value is not always available as a built-in ecommerce metric, but it can be extremely useful in exports, BI tools, or more advanced analytics platforms.
Build Order-Value Bands
Another useful method is to group transactions. For example:
- Under $25
- $25 to $49
- $50 to $99
- $100 to $199
- $200+
Then compare how the order distribution changed. Suppose orders under $50 jump from 20% to 42%, while the $100+ groups shrink. Now you know why AOV fell. This analysis is particularly useful when product prices vary widely. One average number can hide major shifts across the order base.
What Is a Good Average Order Value?
There is no universal good AOV. A $35 AOV may be excellent for a low-priced consumables business. A $350 AOV may be poor for a luxury furniture store.
BigCommerce recommends comparing AOV with your own historical performance as well as relevant business context rather than treating one universal benchmark as the answer.
Your useful benchmark is usually your own store. Compare similar: Customer types, Product mixes, Markets, Channels, Seasons, Promotional conditions.
The question is not: Is $74 a good AOV? It is: Is $74 normal and economically healthy for the orders we are currently generating?
Should You Increase Prices When AOV Falls?
Not automatically. Increasing prices treats only one possible cause.
- If AOV fell because customers are buying fewer items, higher prices may not solve the basket problem.
- If premium products are out of stock, price is not the main issue.
- If a new low-AOV customer segment is growing rapidly, the correct response may be retention rather than pricing.
- If discounts became too aggressive, reducing discount depth might deserve testing.
Pricing decisions should therefore follow the diagnosis rather than become the diagnosis.
Should You Add Upsells Immediately?
Again, only when the data supports it. Upsells and cross-sells are most relevant when shoppers are buying fewer related products than before or when complementary products have clear demand.
Do not add ten aggressive upsell prompts because AOV fell. That can make the shopping experience worse. Instead, identify natural product relationships.
If customers who buy Product A frequently also benefit from Product B, make that connection easy to discover. Useful merchandising supports the customer's purchase. It should not feel like the checkout is fighting them for another $15.
Is Lower AOV Always Bad?
No. This is one of the most important conclusions. Lower AOV may accompany:
- Higher conversion.
- More first-time customers.
- More repeat purchases.
- Expansion into a new market.
- A successful lower-priced product.
- A subscription or replenishment model.
- Reduced reliance on a few unusually large orders.
The real question is whether the overall business economics improved or weakened. Look at AOV together with:
- Revenue.
- Orders.
- Conversion.
- Customer acquisition cost where applicable.
- Retention.
- Gross profit or margin where reliable costs exist.
- Operational costs.
AOV is useful because it describes transaction value. It does not describe the entire health of the business.
When Should an AOV Decline Concern You?
An AOV decline deserves closer attention when it is persistent and accompanied by weaker commercial signals. For example:
- AOV falling.
- Revenue falling.
- Items per order falling.
- Discounting increasing.
- Premium products losing share.
- Gross margin weakening.
- High-value customers becoming less active.
That combination is more concerning than AOV declining while revenue, repeat purchases, and profitability remain healthy. The context tells you whether you have a genuine problem.
A Practical Example
Imagine an ecommerce store sees AOV fall from $88 to $71 over six weeks. The owner assumes customers have become more price-sensitive and prepares a new bundle campaign. Before launching it, the team investigates.
Units per order declined only slightly. Discount rates remained stable. New versus returning customer mix also barely changed. Product analysis reveals that two products priced above $150 generated substantially fewer orders.
Inventory records then show that popular variants of both products were unavailable for most of the six-week period. Meanwhile, a $35 accessory remained fully stocked and produced hundreds of additional transactions.
The real conclusion is: AOV declined mainly because premium products lost availability while lower-priced accessories represented a larger share of purchases. The business does not primarily have an upsell problem. It has a product-availability and mix problem. That is why diagnosis should come before tactics.
A Practical AOV Investigation Order
When customers appear to be spending less per order, investigate in this sequence:
- Validate the metric. Confirm the AOV definition, date range, filters, and comparable period.
- Check units per order. Determine whether baskets actually became smaller.
- Review product mix. See whether lower-priced products gained more share.
- Check premium-product availability. Find stockouts and unavailable high-value variants.
- Measure discounting. Compare both discount depth and frequency.
- Segment customers. Compare new and returning buyers.
- Break down channels and stores. Identify whether the change is concentrated.
- Review markets and geography. Look for changes in regional order behavior.
- Inspect merchandising changes. Bundles, cross-sells, shipping thresholds, subscriptions, and recommendations may matter.
- Examine the order-value distribution. Determine whether all customers are spending less or a few large orders disappeared.
- Check broader economics. Revenue, conversion, retention, and profit tell you whether the lower AOV actually hurts the business.
You usually will not need to change all eleven areas. The objective is to identify the largest explanation first.
Connect AOV With the Rest of Your Store Data
Average order value becomes much more useful when it is connected to the surrounding business. If orders are also increasing while revenue declines, see More Orders but Less Revenue? Here's What Your Data May Be Telling You.
If you want to understand which numbers should be reviewed together rather than independently, see Ecommerce Metrics That Actually Matter. And if your decline appears related to a particular period, use How to Compare Store Performance Between Two Periods before drawing conclusions.
The Same Diagnostic Logic Works Across Ecommerce Platforms
The exact metric calculations and available reports differ across Shopify, WooCommerce, BigCommerce, Adobe Commerce, Wix, Squarespace, Ecwid, PrestaShop, Shopware, Amazon, Etsy, eBay and other or custom ecommerce stores.
A marketplace business may need to analyze listing and channel mix. A direct ecommerce site may have deeper customer and funnel information. A multi-store business may need to normalize several platforms before evaluating the blended AOV. But the central questions remain consistent:
- Are customers purchasing fewer products?
- Are they purchasing cheaper products?
- Are discounts larger?
- Has customer mix changed?
- Have channels or markets shifted?
- Are premium products available?
- Has a normal buying pattern changed at all?
That is the right way to approach a falling AOV.
Where Statty AI Fits
An AOV decline becomes harder to explain when orders, products, customers, inventory, and store performance are analyzed separately.
Statty AI is designed to help ecommerce businesses connect these signals across Shopify, WooCommerce, BigCommerce, Adobe Commerce, Wix, Squarespace, Ecwid, PrestaShop, Shopware, Amazon, Etsy, eBay and other or custom store environments.
The value is not simply seeing: AOV declined 14%.
The useful next step is understanding whether that movement appears alongside smaller baskets, changing product contribution, different customers, inventory constraints, or another meaningful store signal.
You can explore Statty AI analytics features or visit Statty AI to learn more about connected ecommerce intelligence.
Final Thoughts
When customers are spending less per order, do not begin by forcing them to spend more. Begin by understanding what changed. Check whether baskets became smaller. Look at whether lower-priced products gained share.
Review discounts. Separate customer groups. Compare stores, channels, and markets. Make sure premium products were actually available. Then look beyond the average itself to determine whether most orders became smaller or whether you simply lost a few unusually large purchases.
Sometimes a declining average order value is a genuine warning. Sometimes it is a predictable result of acquiring more first-time customers, generating repeat replenishment purchases, entering a new market, or selling a different product mix.
The number alone cannot tell you which situation you are in. The better question is not: How do we push AOV back up? It is: What changed inside our orders, and does that change actually make the business stronger or weaker?